| Business / Energy Data |
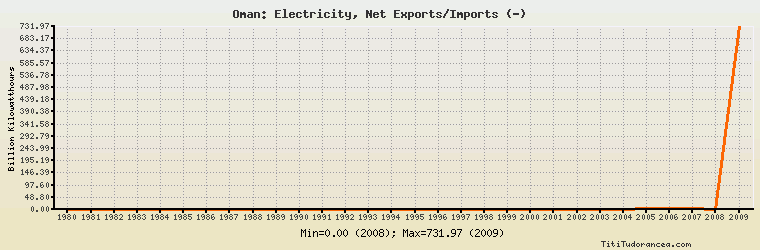
Oman: Electricity, Net Exports/Imports (-)
Billion Kilowatthours
| Year | Oman | Change, percent | Oman, percent of Middle East | Oman, percent of World |
| 1980 | 0.098 | N/A | - | N/A |
| 1981 | 0.125 | 27.551% | - | N/A |
| 1982 | 0.157 | 25.600% | - | N/A |
| 1983 | 0.193 | 22.930% | - | N/A |
| 1984 | 0.241 | 24.870% | - | N/A |
| 1985 | 0.299 | 24.066% | - | N/A |
| 1986 | 0.380 | 27.090% | 190.000% | N/A |
| 1987 | 0.405 | 6.579% | 243.976% | N/A |
| 1988 | 0.451 | 11.358% | 2,255.000% | N/A |
| 1989 | 0.469 | 3.991% | - | N/A |
| 1990 | 0.538 | 14.712% | - | N/A |
| 1991 | 0.545 | 1.301% | - | N/A |
| 1992 | 0.633 | 16.147% | - | N/A |
| 1993 | 0.711 | 12.322% | 368.394% | N/A |
| 1994 | 0.786 | 10.549% | 398.985% | N/A |
| 1995 | 0.854 | 8.651% | 543.949% | N/A |
| 1996 | 0.940 | 10.070% | 246.073% | N/A |
| 1997 | 1.047 | 11.383% | -264.394% | N/A |
| 1998 | 1.304 | 24.546% | -88.587% | N/A |
| 1999 | 1.256 | -3.681% | -177.401% | N/A |
| 2000 | 1.567 | 24.761% | -82.300% | N/A |
| 2001 | 1.551 | -1.021% | -87.233% | N/A |
| 2002 | 1.789 | 15.345% | -77.513% | N/A |
| 2003 | 1.913 | 6.931% | -65.604% | N/A |
| 2004 | 1.779 | -7.005% | -46.890% | N/A |
| 2005 | 2.230 | 25.351% | -97.380% | N/A |
| 2006 | 2.238 | 0.359% | -51.758% | N/A |
| 2007 | 2.219 | -0.849% | -55.007% | N/A |
| 2008 | 0.000 | -100.000% | 0.00% | N/A |
| 2009 | 731.966 | 0.000% | -22,902.566% | N/A |
Historical Energy Data about Oman
Total Oil Supply
Total Consumption of Petroleum Products
Oil and Petroleum Products, Net Exports/Imports (-)
Production of Crude Oil including Lease Condensate
Crude Oil Proved Reserves
Dry Natural Gas Production
Dry Natural Gas Consumption
Dry Natural Gas, Net Exports/Imports (-)
Proved Reserves of Natural Gas
Coal, Net Exports/Imports (-)
Total Electricity Net Generation
Total Electricity Net Consumption
Electricity, Net Exports/Imports (-)
Total Conventional Thermal Electricity Net Generation
Total Primary Energy Production
Total Primary Energy Consumption
Total Carbon Dioxide Emissions from the Consumption of Energy
Population