| Business / Energy Data |
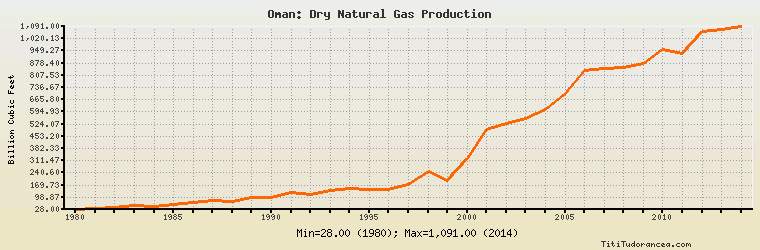
Oman: Dry Natural Gas Production
Billion Cubic Feet
| Year | Oman | Change, percent | Oman, percent of Middle East | Oman, percent of World |
| 1980 | 28.000 | N/A | 1.966% | 0.052% |
| 1981 | 33.000 | 17.857% | 2.275% | 0.060% |
| 1982 | 41.000 | 24.242% | 2.986% | 0.075% |
| 1983 | 51.000 | 24.390% | 3.365% | 0.092% |
| 1984 | 47.000 | -7.843% | 2.345% | 0.078% |
| 1985 | 55.000 | 17.021% | 2.311% | 0.088% |
| 1986 | 70.000 | 27.273% | 2.657% | 0.110% |
| 1987 | 80.000 | 14.286% | 2.639% | 0.120% |
| 1988 | 73.000 | -8.750% | 2.207% | 0.105% |
| 1989 | 99.000 | 35.616% | 2.683% | 0.137% |
| 1990 | 99.000 | 0.000% | 2.664% | 0.134% |
| 1991 | 124.000 | 25.253% | 3.214% | 0.165% |
| 1992 | 117.000 | -5.645% | 2.826% | 0.156% |
| 1993 | 140.000 | 19.658% | 3.159% | 0.183% |
| 1994 | 150.000 | 7.143% | 3.198% | 0.195% |
| 1995 | 147.000 | -2.000% | 2.948% | 0.188% |
| 1996 | 145.000 | -1.361% | 2.622% | 0.180% |
| 1997 | 176.000 | 21.379% | 2.829% | 0.219% |
| 1998 | 248.000 | 40.909% | 3.760% | 0.303% |
| 1999 | 197.000 | -20.565% | 2.843% | 0.235% |
| 2000 | 322.000 | 63.452% | 4.254% | 0.370% |
| 2001 | 493.000 | 53.106% | 6.176% | 0.555% |
| 2002 | 530.000 | 7.505% | 6.087% | 0.585% |
| 2003 | 558.000 | 5.283% | 6.075% | 0.597% |
| 2004 | 607.000 | 8.781% | 6.103% | 0.635% |
| 2005 | 699.000 | 15.157% | 6.208% | 0.711% |
| 2006 | 837.000 | 19.742% | 7.005% | 0.824% |
| 2007 | 849.000 | 1.434% | 6.741% | 0.815% |
| 2008 | 850.000 | 0.118% | 6.291% | 0.788% |
| 2009 | 875.000 | 2.941% | 5.950% | 0.830% |
| 2010 | 957.000 | 9.371% | 5.752% | 0.852% |
| 2011 | 937.000 | -2.090% | 5.127% | 0.804% |
| 2012 | 1,060.000 | 13.127% | 5.498% | 0.888% |
| 2013 | 1,073.000 | 1.226% | 5.386% | 0.887% |
| 2014 | 1,091.000 | 1.678% | 5.353% | 0.892% |
Historical Energy Data about Oman
Total Oil Supply
Total Consumption of Petroleum Products
Oil and Petroleum Products, Net Exports/Imports (-)
Production of Crude Oil including Lease Condensate
Crude Oil Proved Reserves
Dry Natural Gas Production
Dry Natural Gas Consumption
Dry Natural Gas, Net Exports/Imports (-)
Proved Reserves of Natural Gas
Coal, Net Exports/Imports (-)
Total Electricity Net Generation
Total Electricity Net Consumption
Electricity, Net Exports/Imports (-)
Total Conventional Thermal Electricity Net Generation
Total Primary Energy Production
Total Primary Energy Consumption
Total Carbon Dioxide Emissions from the Consumption of Energy
Population