| Business / Energy Data |
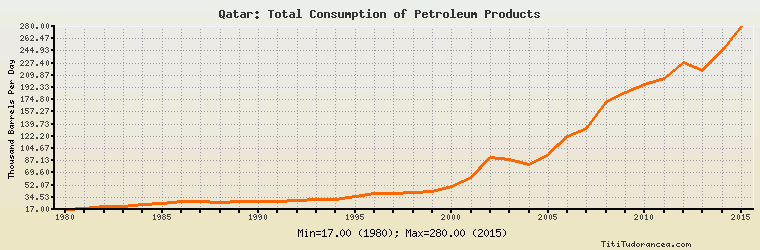
Qatar: Total Consumption of Petroleum Products
Thousand Barrels Per Day
| Year | Qatar | Change, percent | Qatar, percent of Middle East | Qatar, percent of World |
| 1980 | 17.000 | N/A | 0.831% | 0.027% |
| 1981 | 18.000 | 5.882% | 0.825% | 0.030% |
| 1982 | 21.000 | 16.667% | 0.899% | 0.035% |
| 1983 | 22.000 | 4.762% | 0.849% | 0.037% |
| 1984 | 24.000 | 9.091% | 0.912% | 0.040% |
| 1985 | 25.000 | 4.167% | 0.882% | 0.042% |
| 1986 | 28.000 | 12.000% | 0.945% | 0.045% |
| 1987 | 29.000 | 3.571% | 0.953% | 0.046% |
| 1988 | 27.000 | -6.897% | 0.859% | 0.042% |
| 1989 | 28.000 | 3.704% | 0.861% | 0.042% |
| 1990 | 28.000 | 0.000% | 0.804% | 0.042% |
| 1991 | 28.000 | 0.000% | 0.792% | 0.042% |
| 1992 | 30.000 | 7.143% | 0.803% | 0.045% |
| 1993 | 32.000 | 6.667% | 0.815% | 0.047% |
| 1994 | 32.000 | 0.000% | 0.779% | 0.046% |
| 1995 | 35.000 | 9.375% | 0.844% | 0.050% |
| 1996 | 40.000 | 14.286% | 0.947% | 0.056% |
| 1997 | 40.000 | 0.000% | 0.904% | 0.054% |
| 1998 | 42.000 | 5.000% | 0.925% | 0.057% |
| 1999 | 43.000 | 2.381% | 0.930% | 0.057% |
| 2000 | 50.637 | 17.760% | 1.027% | 0.066% |
| 2001 | 63.413 | 25.231% | 1.227% | 0.082% |
| 2002 | 92.075 | 45.199% | 1.752% | 0.117% |
| 2003 | 88.197 | -4.212% | 1.652% | 0.110% |
| 2004 | 81.572 | -7.512% | 1.436% | 0.098% |
| 2005 | 96.018 | 17.710% | 1.590% | 0.113% |
| 2006 | 121.895 | 26.950% | 1.948% | 0.142% |
| 2007 | 132.912 | 9.038% | 2.060% | 0.154% |
| 2008 | 172.403 | 29.712% | 2.455% | 0.201% |
| 2009 | 184.850 | 7.220% | 2.513% | 0.216% |
| 2010 | 196.635 | 6.375% | 2.566% | 0.221% |
| 2011 | 205.860 | 4.691% | 2.626% | 0.229% |
| 2012 | 228.260 | 10.881% | 2.773% | 0.251% |
| 2013 | 216.501 | -5.152% | 2.633% | 0.235% |
| 2014 | 245.878 | 13.569% | 2.888% | 0.263% |
| 2015 | 280.000 | 13.878% | 3.216% | 0.294% |
Historical Energy Data about Qatar
Total Oil Supply
Total Consumption of Petroleum Products
Oil and Petroleum Products, Net Exports/Imports (-)
Production of Crude Oil including Lease Condensate
Crude Oil Proved Reserves
Dry Natural Gas Production
Dry Natural Gas Consumption
Dry Natural Gas, Net Exports/Imports (-)
Proved Reserves of Natural Gas
Coal, Net Exports/Imports (-)
Total Electricity Net Generation
Total Electricity Net Consumption
Electricity, Net Exports/Imports (-)
Total Conventional Thermal Electricity Net Generation
Total Primary Energy Production
Total Primary Energy Consumption
Total Carbon Dioxide Emissions from the Consumption of Energy
Population