| Business / Energy Data |
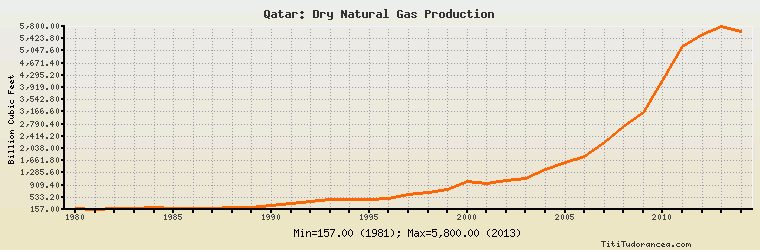
Qatar: Dry Natural Gas Production
Billion Cubic Feet
| Year | Qatar | Change, percent | Qatar, percent of Middle East | Qatar, percent of World |
| 1980 | 184.000 | N/A | 12.921% | 0.345% |
| 1981 | 157.000 | -14.674% | 10.822% | 0.287% |
| 1982 | 186.000 | 18.471% | 13.547% | 0.341% |
| 1983 | 174.000 | -6.452% | 11.479% | 0.316% |
| 1984 | 209.000 | 20.115% | 10.429% | 0.348% |
| 1985 | 191.000 | -8.612% | 8.025% | 0.307% |
| 1986 | 193.000 | 1.047% | 7.326% | 0.304% |
| 1987 | 198.000 | 2.591% | 6.532% | 0.297% |
| 1988 | 207.000 | 4.545% | 6.259% | 0.296% |
| 1989 | 215.000 | 3.865% | 5.826% | 0.298% |
| 1990 | 276.000 | 28.372% | 7.428% | 0.375% |
| 1991 | 328.000 | 18.841% | 8.502% | 0.437% |
| 1992 | 401.000 | 22.256% | 9.686% | 0.534% |
| 1993 | 477.000 | 18.953% | 10.762% | 0.623% |
| 1994 | 477.000 | 0.000% | 10.171% | 0.619% |
| 1995 | 477.000 | 0.000% | 9.565% | 0.611% |
| 1996 | 484.000 | 1.468% | 8.754% | 0.601% |
| 1997 | 614.000 | 26.860% | 9.870% | 0.763% |
| 1998 | 691.000 | 12.541% | 10.477% | 0.844% |
| 1999 | 779.000 | 12.735% | 11.242% | 0.929% |
| 2000 | 1,028.000 | 31.964% | 13.581% | 1.180% |
| 2001 | 954.000 | -7.198% | 11.951% | 1.074% |
| 2002 | 1,042.000 | 9.224% | 11.968% | 1.151% |
| 2003 | 1,109.000 | 6.430% | 12.074% | 1.187% |
| 2004 | 1,383.000 | 24.707% | 13.905% | 1.446% |
| 2005 | 1,617.000 | 16.920% | 14.361% | 1.645% |
| 2006 | 1,790.000 | 10.699% | 14.982% | 1.761% |
| 2007 | 2,232.000 | 24.693% | 17.723% | 2.143% |
| 2008 | 2,719.000 | 21.819% | 20.125% | 2.521% |
| 2009 | 3,154.000 | 15.999% | 21.449% | 2.992% |
| 2010 | 4,121.000 | 30.659% | 24.769% | 3.668% |
| 2011 | 5,198.000 | 26.134% | 28.445% | 4.461% |
| 2012 | 5,546.000 | 6.695% | 28.767% | 4.647% |
| 2013 | 5,800.000 | 4.580% | 29.115% | 4.796% |
| 2014 | 5,650.000 | -2.586% | 27.721% | 4.618% |
Historical Energy Data about Qatar
Total Oil Supply
Total Consumption of Petroleum Products
Oil and Petroleum Products, Net Exports/Imports (-)
Production of Crude Oil including Lease Condensate
Crude Oil Proved Reserves
Dry Natural Gas Production
Dry Natural Gas Consumption
Dry Natural Gas, Net Exports/Imports (-)
Proved Reserves of Natural Gas
Coal, Net Exports/Imports (-)
Total Electricity Net Generation
Total Electricity Net Consumption
Electricity, Net Exports/Imports (-)
Total Conventional Thermal Electricity Net Generation
Total Primary Energy Production
Total Primary Energy Consumption
Total Carbon Dioxide Emissions from the Consumption of Energy
Population