| Business / Energy Data |
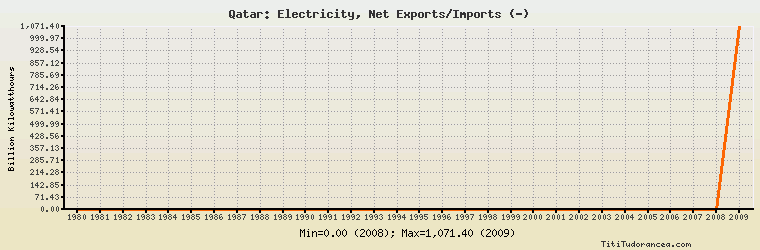
Qatar: Electricity, Net Exports/Imports (-)
Billion Kilowatthours
| Year | Qatar | Change, percent | Qatar, percent of Middle East | Qatar, percent of World |
| 1980 | 0.243 | N/A | - | N/A |
| 1981 | 0.293 | 20.576% | - | N/A |
| 1982 | 0.282 | -3.754% | - | N/A |
| 1983 | 0.291 | 3.191% | - | N/A |
| 1984 | 0.300 | 3.093% | - | N/A |
| 1985 | 0.215 | -28.333% | - | N/A |
| 1986 | 0.199 | -7.442% | 99.500% | N/A |
| 1987 | 0.216 | 8.543% | 130.120% | N/A |
| 1988 | 0.321 | 48.611% | 1,605.000% | N/A |
| 1989 | 0.230 | -28.349% | - | N/A |
| 1990 | 0.250 | 8.696% | - | N/A |
| 1991 | 0.262 | 4.800% | - | N/A |
| 1992 | 0.280 | 6.870% | - | N/A |
| 1993 | 0.323 | 15.357% | 167.358% | N/A |
| 1994 | 0.360 | 11.455% | 182.741% | N/A |
| 1995 | 0.462 | 28.333% | 294.268% | N/A |
| 1996 | 0.392 | -15.152% | 102.618% | N/A |
| 1997 | 0.412 | 5.102% | -104.040% | N/A |
| 1998 | 0.526 | 27.670% | -35.734% | N/A |
| 1999 | 0.596 | 13.308% | -84.181% | N/A |
| 2000 | 0.633 | 6.208% | -33.246% | N/A |
| 2001 | 0.694 | 9.637% | -39.033% | N/A |
| 2002 | 0.764 | 10.086% | -33.102% | N/A |
| 2003 | 0.837 | 9.555% | -28.704% | N/A |
| 2004 | 0.916 | 9.438% | -24.143% | N/A |
| 2005 | 1.019 | 11.245% | -44.498% | N/A |
| 2006 | 1.214 | 19.136% | -28.076% | N/A |
| 2007 | 1.388 | 14.333% | -34.408% | N/A |
| 2008 | 0.000 | -100.000% | 0.00% | N/A |
| 2009 | 1,071.397 | 0.000% | -33,523.060% | N/A |
Historical Energy Data about Qatar
Total Oil Supply
Total Consumption of Petroleum Products
Oil and Petroleum Products, Net Exports/Imports (-)
Production of Crude Oil including Lease Condensate
Crude Oil Proved Reserves
Dry Natural Gas Production
Dry Natural Gas Consumption
Dry Natural Gas, Net Exports/Imports (-)
Proved Reserves of Natural Gas
Coal, Net Exports/Imports (-)
Total Electricity Net Generation
Total Electricity Net Consumption
Electricity, Net Exports/Imports (-)
Total Conventional Thermal Electricity Net Generation
Total Primary Energy Production
Total Primary Energy Consumption
Total Carbon Dioxide Emissions from the Consumption of Energy
Population