| Business / Energy Data |
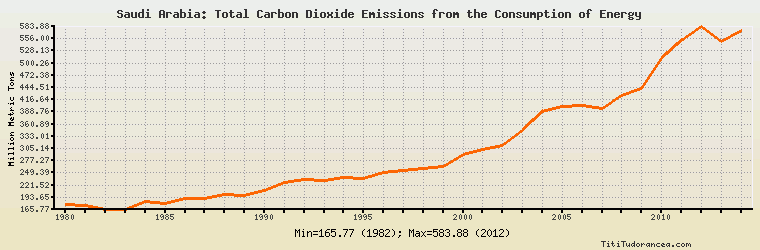
Saudi Arabia: Total Carbon Dioxide Emissions from the Consumption of Energy
Million Metric Tons
| Year | Saudi Arabia | Change, percent | Saudi Arabia, percent of Middle East | Saudi Arabia, percent of World |
| 1980 | 176.948 | N/A | 35.989% | 0.962% |
| 1981 | 174.912 | -1.151% | 37.389% | 0.964% |
| 1982 | 165.772 | -5.225% | 34.016% | 0.916% |
| 1983 | 165.945 | 0.104% | 31.253% | 0.911% |
| 1984 | 184.514 | 11.190% | 33.216% | 0.971% |
| 1985 | 179.482 | -2.727% | 31.116% | 0.924% |
| 1986 | 190.482 | 6.129% | 30.717% | 0.961% |
| 1987 | 191.245 | 0.401% | 29.625% | 0.939% |
| 1988 | 200.107 | 4.634% | 29.527% | 0.951% |
| 1989 | 198.580 | -0.763% | 27.988% | 0.932% |
| 1990 | 208.312 | 4.901% | 28.673% | 0.959% |
| 1991 | 226.563 | 8.761% | 28.970% | 1.063% |
| 1992 | 234.973 | 3.712% | 28.919% | 1.112% |
| 1993 | 232.405 | -1.093% | 27.853% | 1.093% |
| 1994 | 239.507 | 3.056% | 27.336% | 1.117% |
| 1995 | 235.792 | -1.551% | 26.282% | 1.075% |
| 1996 | 249.772 | 5.929% | 26.862% | 1.115% |
| 1997 | 254.728 | 1.984% | 25.934% | 1.133% |
| 1998 | 258.467 | 1.468% | 25.508% | 1.147% |
| 1999 | 264.168 | 2.206% | 25.141% | 1.154% |
| 2000 | 290.770 | 10.070% | 26.710% | 1.230% |
| 2001 | 301.755 | 3.778% | 27.063% | 1.265% |
| 2002 | 311.644 | 3.277% | 26.650% | 1.277% |
| 2003 | 347.058 | 11.364% | 28.056% | 1.356% |
| 2004 | 389.258 | 12.159% | 29.349% | 1.453% |
| 2005 | 401.472 | 3.138% | 27.866% | 1.442% |
| 2006 | 402.497 | 0.255% | 26.966% | 1.405% |
| 2007 | 396.395 | -1.516% | 25.947% | 1.349% |
| 2008 | 425.791 | 7.416% | 26.181% | 1.431% |
| 2009 | 441.917 | 3.787% | 25.402% | 1.495% |
| 2010 | 510.957 | 15.623% | 27.597% | 1.640% |
| 2011 | 551.307 | 7.897% | 28.334% | 1.703% |
| 2012 | 583.877 | 5.908% | 28.706% | 1.765% |
| 2013 | 550.257 | -5.758% | 27.217% | 1.632% |
| 2014 | 575.838 | 4.649% | 27.572% | 1.707% |
Historical Energy Data about Saudi Arabia
Total Oil Supply
Total Consumption of Petroleum Products
Oil and Petroleum Products, Net Exports/Imports (-)
Production of Crude Oil including Lease Condensate
Crude Oil Proved Reserves
Dry Natural Gas Production
Dry Natural Gas Consumption
Proved Reserves of Natural Gas
Total Coal Consumption
Coal, Net Exports/Imports (-)
Total Electricity Net Generation
Total Electricity Net Consumption
Electricity, Net Exports/Imports (-)
Total Conventional Thermal Electricity Net Generation
Total Primary Energy Production
Total Primary Energy Consumption
Total Carbon Dioxide Emissions from the Consumption of Energy
Population