| Business / Energy Data |
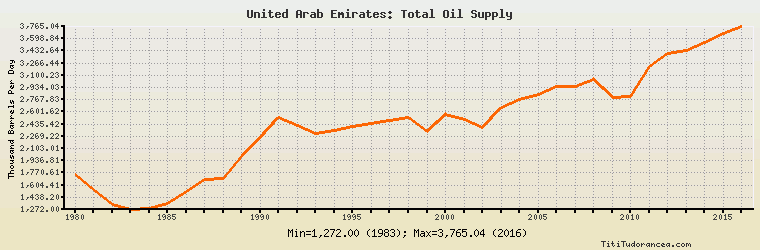
United Arab Emirates: Total Oil Supply
Thousand Barrels Per Day
| Year | United Arab Emirates | Change, percent | United Arab Emirates, percent of Middle East | United Arab Emirates, percent of World |
| 1980 | 1,747.000 | N/A | 9.183% | 2.730% |
| 1981 | 1,538.000 | -11.963% | 9.368% | 2.538% |
| 1982 | 1,343.000 | -12.679% | 10.096% | 2.312% |
| 1983 | 1,272.000 | -5.287% | 10.408% | 2.196% |
| 1984 | 1,279.000 | 0.550% | 10.640% | 2.147% |
| 1985 | 1,356.000 | 6.020% | 12.326% | 2.292% |
| 1986 | 1,515.000 | 11.726% | 11.529% | 2.462% |
| 1987 | 1,686.000 | 11.287% | 12.371% | 2.715% |
| 1988 | 1,695.000 | 0.534% | 11.085% | 2.632% |
| 1989 | 1,990.000 | 17.404% | 11.818% | 3.037% |
| 1990 | 2,252.000 | 13.166% | 12.906% | 3.390% |
| 1991 | 2,531.000 | 12.389% | 14.840% | 3.815% |
| 1992 | 2,410.000 | -4.781% | 13.129% | 3.621% |
| 1993 | 2,305.000 | -4.357% | 11.948% | 3.435% |
| 1994 | 2,343.000 | 1.649% | 11.695% | 3.414% |
| 1995 | 2,396.000 | 2.262% | 11.732% | 3.408% |
| 1996 | 2,439.000 | 1.795% | 11.830% | 3.388% |
| 1997 | 2,480.000 | 1.681% | 11.572% | 3.341% |
| 1998 | 2,519.000 | 1.573% | 11.068% | 3.328% |
| 1999 | 2,337.000 | -7.225% | 10.568% | 3.123% |
| 2000 | 2,572.325 | 10.070% | 10.953% | 3.309% |
| 2001 | 2,500.041 | -2.810% | 10.968% | 3.219% |
| 2002 | 2,386.833 | -4.528% | 11.065% | 3.096% |
| 2003 | 2,660.830 | 11.480% | 11.573% | 3.342% |
| 2004 | 2,766.745 | 3.981% | 11.036% | 3.315% |
| 2005 | 2,844.626 | 2.815% | 10.902% | 3.342% |
| 2006 | 2,948.469 | 3.650% | 11.440% | 3.461% |
| 2007 | 2,947.497 | -0.033% | 11.657% | 3.458% |
| 2008 | 3,046.873 | 3.372% | 11.384% | 3.517% |
| 2009 | 2,794.552 | -8.281% | 11.034% | 3.255% |
| 2010 | 2,814.832 | 0.726% | 10.735% | 3.190% |
| 2011 | 3,216.473 | 14.269% | 11.623% | 3.622% |
| 2012 | 3,401.312 | 5.747% | 12.199% | 3.747% |
| 2013 | 3,443.705 | 1.246% | 12.535% | 3.772% |
| 2014 | 3,547.897 | 3.026% | 12.699% | 3.781% |
| 2015 | 3,673.157 | 3.531% | 12.497% | 3.794% |
| 2016 | 3,765.044 | 2.502% | 12.145% | 3.875% |
Historical Energy Data about United Arab Emirates
Total Oil Supply
Total Consumption of Petroleum Products
Oil and Petroleum Products, Net Exports/Imports (-)
Production of Crude Oil including Lease Condensate
Crude Oil Proved Reserves
Dry Natural Gas Production
Dry Natural Gas Consumption
Dry Natural Gas, Net Exports/Imports (-)
Proved Reserves of Natural Gas
Coal, Net Exports/Imports (-)
Total Electricity Net Generation
Total Electricity Net Consumption
Electricity, Net Exports/Imports (-)
Total Conventional Thermal Electricity Net Generation
Total Primary Energy Production
Total Primary Energy Consumption
Total Carbon Dioxide Emissions from the Consumption of Energy
Population