| Business / Energy Data |
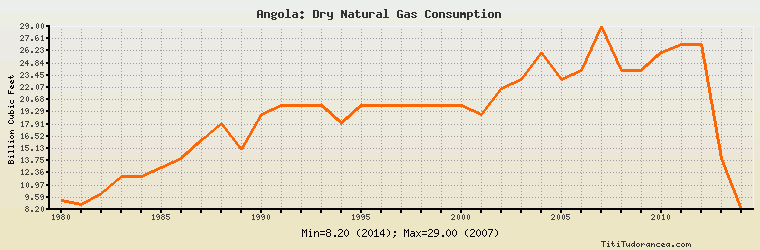
Angola: Dry Natural Gas Consumption
Billion Cubic Feet
| Year | Angola | Change, percent | Angola, percent of Africa | Angola, percent of World |
| 1980 | 9.200 | N/A | 1.251% | 0.017% |
| 1981 | 8.800 | -4.348% | 1.441% | 0.016% |
| 1982 | 10.000 | 13.636% | 1.222% | 0.019% |
| 1983 | 12.000 | 20.000% | 1.196% | 0.022% |
| 1984 | 12.000 | 0.000% | 1.094% | 0.020% |
| 1985 | 13.000 | 8.333% | 1.213% | 0.021% |
| 1986 | 14.000 | 7.692% | 1.224% | 0.022% |
| 1987 | 16.000 | 14.286% | 1.291% | 0.024% |
| 1988 | 18.000 | 12.500% | 1.376% | 0.026% |
| 1989 | 15.000 | -16.667% | 1.120% | 0.021% |
| 1990 | 19.000 | 26.667% | 1.384% | 0.026% |
| 1991 | 20.000 | 5.263% | 1.329% | 0.027% |
| 1992 | 20.000 | 0.000% | 1.349% | 0.027% |
| 1993 | 20.000 | 0.000% | 1.297% | 0.026% |
| 1994 | 18.000 | -10.000% | 1.119% | 0.023% |
| 1995 | 20.000 | 11.111% | 1.184% | 0.025% |
| 1996 | 20.000 | 0.000% | 1.118% | 0.025% |
| 1997 | 20.000 | 0.000% | 1.118% | 0.025% |
| 1998 | 20.000 | 0.000% | 1.091% | 0.024% |
| 1999 | 20.000 | 0.000% | 1.069% | 0.024% |
| 2000 | 20.000 | 0.000% | 0.981% | 0.023% |
| 2001 | 19.000 | -5.000% | 0.832% | 0.022% |
| 2002 | 22.000 | 15.789% | 0.930% | 0.024% |
| 2003 | 23.000 | 4.545% | 0.893% | 0.025% |
| 2004 | 26.000 | 13.043% | 0.987% | 0.027% |
| 2005 | 23.000 | -11.538% | 0.762% | 0.023% |
| 2006 | 24.000 | 4.348% | 0.824% | 0.024% |
| 2007 | 29.000 | 20.833% | 0.968% | 0.027% |
| 2008 | 24.000 | -17.241% | 0.664% | 0.022% |
| 2009 | 24.000 | 0.000% | 0.709% | 0.023% |
| 2010 | 26.000 | 8.333% | 0.731% | 0.023% |
| 2011 | 27.000 | 3.846% | 0.691% | 0.023% |
| 2012 | 27.000 | 0.000% | 0.603% | 0.022% |
| 2013 | 14.000 | -48.148% | 0.312% | 0.011% |
| 2014 | 8.200 | -41.429% | 0.175% | 0.007% |
Historical Energy Data about Angola
Total Oil Supply
Total Consumption of Petroleum Products
Oil and Petroleum Products, Net Exports/Imports (-)
Production of Crude Oil including Lease Condensate
Crude Oil Proved Reserves
Dry Natural Gas Production
Dry Natural Gas Consumption
Dry Natural Gas, Net Exports/Imports (-)
Proved Reserves of Natural Gas
Coal, Net Exports/Imports (-)
Total Electricity Net Generation
Total Electricity Net Consumption
Electricity, Net Exports/Imports (-)
Total Conventional Thermal Electricity Net Generation
Hydroelectricity Net Generation
Total Primary Energy Production
Total Primary Energy Consumption
Total Carbon Dioxide Emissions from the Consumption of Energy
Population