| Business / Energy Data |
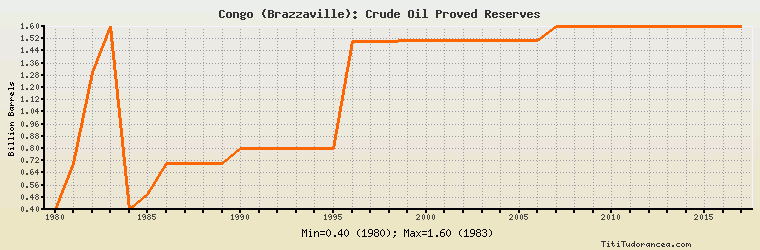
Congo (Brazzaville): Crude Oil Proved Reserves
Billion Barrels
| Year | Congo (Brazzaville) | Change, percent | Congo (Brazzaville), percent of Africa | Congo (Brazzaville), percent of World |
| 1980 | 0.400 | N/A | 0.700% | 0.062% |
| 1981 | 0.700 | 75.000% | 1.261% | 0.108% |
| 1982 | 1.300 | 85.714% | 2.277% | 0.194% |
| 1983 | 1.600 | 23.077% | 2.735% | 0.240% |
| 1984 | 0.400 | -75.000% | 0.710% | 0.060% |
| 1985 | 0.500 | 25.000% | 0.896% | 0.071% |
| 1986 | 0.700 | 40.000% | 1.230% | 0.100% |
| 1987 | 0.700 | 0.000% | 1.280% | 0.100% |
| 1988 | 0.700 | 0.000% | 1.270% | 0.079% |
| 1989 | 0.700 | 0.000% | 1.232% | 0.077% |
| 1990 | 0.800 | 14.286% | 1.358% | 0.080% |
| 1991 | 0.800 | 0.000% | 1.336% | 0.080% |
| 1992 | 0.800 | 0.000% | 1.318% | 0.086% |
| 1993 | 0.800 | 0.000% | 1.288% | 0.085% |
| 1994 | 0.800 | 0.000% | 1.288% | 0.085% |
| 1995 | 0.800 | 0.000% | 1.284% | 0.085% |
| 1996 | 1.500 | 87.500% | 2.035% | 0.158% |
| 1997 | 1.500 | 0.000% | 2.193% | 0.147% |
| 1998 | 1.500 | 0.000% | 2.122% | 0.147% |
| 1999 | 1.506 | 0.400% | 1.996% | 0.146% |
| 2000 | 1.506 | 0.000% | 2.011% | 0.148% |
| 2001 | 1.506 | 0.000% | 2.011% | 0.146% |
| 2002 | 1.506 | 0.000% | 1.964% | 0.146% |
| 2003 | 1.506 | 0.000% | 1.945% | 0.124% |
| 2004 | 1.506 | 0.000% | 1.730% | 0.119% |
| 2005 | 1.506 | 0.000% | 1.494% | 0.118% |
| 2006 | 1.506 | 0.000% | 1.468% | 0.117% |
| 2007 | 1.600 | 6.242% | 1.403% | 0.121% |
| 2008 | 1.600 | 0.000% | 1.393% | 0.120% |
| 2009 | 1.600 | 0.000% | 1.367% | 0.120% |
| 2010 | 1.600 | 0.000% | 1.343% | 0.118% |
| 2011 | 1.600 | 0.000% | 1.294% | 0.108% |
| 2012 | 1.600 | 0.000% | 1.288% | 0.105% |
| 2013 | 1.600 | 0.000% | 1.253% | 0.097% |
| 2014 | 1.600 | 0.000% | 1.263% | 0.097% |
| 2015 | 1.600 | 0.000% | 1.265% | 0.097% |
| 2016 | 1.600 | 0.000% | 1.271% | 0.097% |
| 2017 | 1.600 | 0.000% | 1.272% | N/A |
Historical Energy Data about Congo (Brazzaville)
Total Oil Supply
Total Consumption of Petroleum Products
Oil and Petroleum Products, Net Exports/Imports (-)
Production of Crude Oil including Lease Condensate
Crude Oil Proved Reserves
Dry Natural Gas Production
Dry Natural Gas Consumption
Dry Natural Gas, Net Exports/Imports (-)
Proved Reserves of Natural Gas
Coal, Net Exports/Imports (-)
Total Electricity Net Generation
Total Electricity Net Consumption
Total Electricity Imports
Electricity, Net Exports/Imports (-)
Total Conventional Thermal Electricity Net Generation
Hydroelectricity Net Generation
Total Biofuels Production
Total Primary Energy Production
Total Primary Energy Consumption
Total Carbon Dioxide Emissions from the Consumption of Energy
Population