| Business / Energy Data |
Congo (Brazzaville): Total Consumption of Petroleum Products
Thousand Barrels Per Day
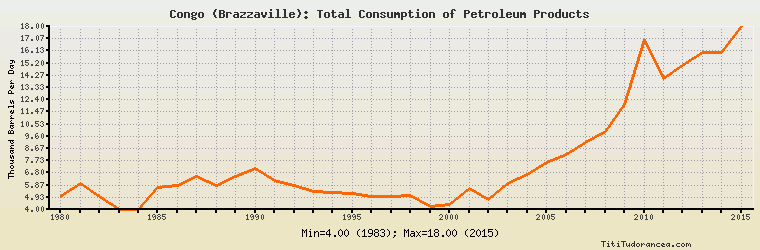
| Year | Congo (Brazzaville) | Change, percent | Congo (Brazzaville), percent of Africa | Congo (Brazzaville), percent of World |
| 1980 | 5.000 | N/A | 0.339% | 0.008% |
| 1981 | 6.000 | 20.000% | 0.380% | 0.010% |
| 1982 | 5.000 | -16.667% | 0.301% | 0.008% |
| 1983 | 4.000 | -20.000% | 0.236% | 0.007% |
| 1984 | 4.000 | 0.000% | 0.227% | 0.007% |
| 1985 | 5.700 | 42.500% | 0.312% | 0.009% |
| 1986 | 5.800 | 1.754% | 0.319% | 0.009% |
| 1987 | 6.500 | 12.069% | 0.354% | 0.010% |
| 1988 | 5.800 | -10.769% | 0.304% | 0.009% |
| 1989 | 6.500 | 12.069% | 0.328% | 0.010% |
| 1990 | 7.100 | 9.231% | 0.343% | 0.011% |
| 1991 | 6.200 | -12.676% | 0.293% | 0.009% |
| 1992 | 5.800 | -6.452% | 0.269% | 0.009% |
| 1993 | 5.400 | -6.897% | 0.248% | 0.008% |
| 1994 | 5.300 | -1.852% | 0.243% | 0.008% |
| 1995 | 5.200 | -1.887% | 0.231% | 0.007% |
| 1996 | 5.000 | -3.846% | 0.217% | 0.007% |
| 1997 | 5.000 | 0.000% | 0.211% | 0.007% |
| 1998 | 5.100 | 2.000% | 0.212% | 0.007% |
| 1999 | 4.200 | -17.647% | 0.171% | 0.006% |
| 2000 | 4.400 | 4.762% | 0.172% | 0.006% |
| 2001 | 5.600 | 27.273% | 0.214% | 0.007% |
| 2002 | 4.800 | -14.286% | 0.177% | 0.006% |
| 2003 | 6.000 | 25.000% | 0.218% | 0.007% |
| 2004 | 6.700 | 11.667% | 0.235% | 0.008% |
| 2005 | 7.600 | 13.433% | 0.256% | 0.009% |
| 2006 | 8.200 | 7.895% | 0.273% | 0.010% |
| 2007 | 9.100 | 10.976% | 0.298% | 0.011% |
| 2008 | 10.000 | 9.890% | 0.314% | 0.012% |
| 2009 | 12.000 | 20.000% | 0.359% | 0.014% |
| 2010 | 17.000 | 41.667% | 0.483% | 0.019% |
| 2011 | 14.000 | -17.647% | 0.406% | 0.016% |
| 2012 | 15.000 | 7.143% | 0.412% | 0.016% |
| 2013 | 16.000 | 6.667% | 0.420% | 0.017% |
| 2014 | 16.000 | 0.000% | 0.401% | 0.017% |
| 2015 | 18.000 | 12.500% | 0.450% | 0.019% |
Historical Energy Data about Congo (Brazzaville)
Total Oil Supply
Total Consumption of Petroleum Products
Oil and Petroleum Products, Net Exports/Imports (-)
Production of Crude Oil including Lease Condensate
Crude Oil Proved Reserves
Dry Natural Gas Production
Dry Natural Gas Consumption
Dry Natural Gas, Net Exports/Imports (-)
Proved Reserves of Natural Gas
Coal, Net Exports/Imports (-)
Total Electricity Net Generation
Total Electricity Net Consumption
Total Electricity Imports
Electricity, Net Exports/Imports (-)
Total Conventional Thermal Electricity Net Generation
Hydroelectricity Net Generation
Total Biofuels Production
Total Primary Energy Production
Total Primary Energy Consumption
Total Carbon Dioxide Emissions from the Consumption of Energy
Population