| Business / Energy Data |
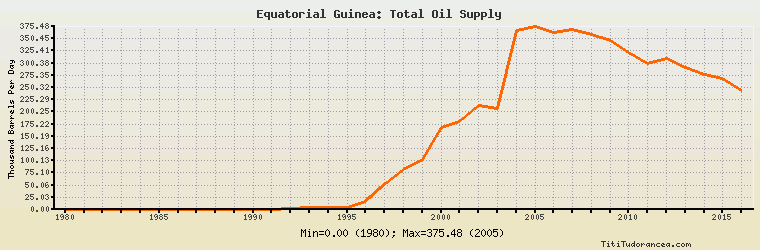
Equatorial Guinea: Total Oil Supply
Thousand Barrels Per Day
| Year | Equatorial Guinea | Change, percent | Equatorial Guinea, percent of Africa | Equatorial Guinea, percent of World |
| 1980 | 0.000 | N/A | 0.00% | 0.00% |
| 1981 | 0.000 | 0.000% | 0.00% | 0.00% |
| 1982 | 0.000 | 0.000% | 0.00% | 0.00% |
| 1983 | 0.000 | 0.000% | 0.00% | 0.00% |
| 1984 | 0.000 | 0.000% | 0.00% | 0.00% |
| 1985 | 0.000 | 0.000% | 0.00% | 0.00% |
| 1986 | 0.000 | 0.000% | 0.00% | 0.00% |
| 1987 | 0.000 | 0.000% | 0.00% | 0.00% |
| 1988 | 0.000 | 0.000% | 0.00% | 0.00% |
| 1989 | 0.000 | 0.000% | 0.00% | 0.00% |
| 1990 | 0.000 | 0.000% | 0.00% | 0.00% |
| 1991 | 0.100 | 0.000% | 0.001% | 0.000% |
| 1992 | 1.600 | 1,500.000% | 0.023% | 0.002% |
| 1993 | 4.500 | 181.250% | 0.064% | 0.007% |
| 1994 | 5.000 | 11.111% | 0.071% | 0.007% |
| 1995 | 5.000 | 0.000% | 0.068% | 0.007% |
| 1996 | 17.000 | 240.000% | 0.226% | 0.024% |
| 1997 | 52.000 | 205.882% | 0.665% | 0.070% |
| 1998 | 83.000 | 59.615% | 1.066% | 0.110% |
| 1999 | 102.000 | 22.892% | 1.319% | 0.136% |
| 2000 | 167.500 | 64.216% | 2.096% | 0.215% |
| 2001 | 181.438 | 8.321% | 2.260% | 0.234% |
| 2002 | 212.562 | 17.154% | 2.613% | 0.276% |
| 2003 | 206.466 | -2.868% | 2.399% | 0.259% |
| 2004 | 368.208 | 78.338% | 3.950% | 0.441% |
| 2005 | 375.477 | 1.974% | 3.722% | 0.441% |
| 2006 | 362.866 | -3.359% | 3.559% | 0.426% |
| 2007 | 368.529 | 1.561% | 3.515% | 0.432% |
| 2008 | 359.203 | -2.531% | 3.395% | 0.415% |
| 2009 | 346.016 | -3.671% | 3.316% | 0.403% |
| 2010 | 322.710 | -6.736% | 3.022% | 0.366% |
| 2011 | 298.888 | -7.382% | 3.223% | 0.337% |
| 2012 | 310.400 | 3.852% | 3.131% | 0.342% |
| 2013 | 290.797 | -6.315% | 3.140% | 0.319% |
| 2014 | 278.000 | -4.401% | 3.180% | 0.296% |
| 2015 | 268.000 | -3.597% | 3.100% | 0.277% |
| 2016 | 244.000 | -8.955% | 2.976% | 0.251% |
Historical Energy Data about Equatorial Guinea
Total Oil Supply
Total Consumption of Petroleum Products
Oil and Petroleum Products, Net Exports/Imports (-)
Production of Crude Oil including Lease Condensate
Crude Oil Proved Reserves
Dry Natural Gas Production
Dry Natural Gas Consumption
Dry Natural Gas, Net Exports/Imports (-)
Proved Reserves of Natural Gas
Coal, Net Exports/Imports (-)
Total Electricity Net Generation
Total Electricity Net Consumption
Electricity, Net Exports/Imports (-)
Total Conventional Thermal Electricity Net Generation
Hydroelectricity Net Generation
Total Primary Energy Production
Total Primary Energy Consumption
Total Carbon Dioxide Emissions from the Consumption of Energy
Population