| Business / Energy Data |
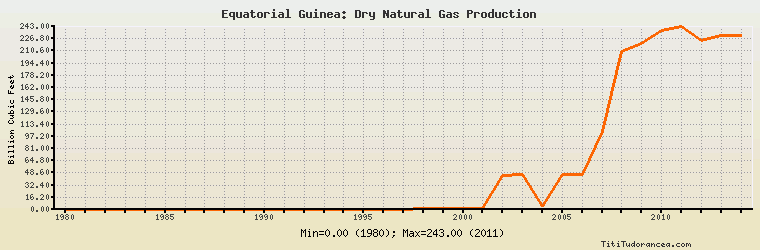
Equatorial Guinea: Dry Natural Gas Production
Billion Cubic Feet
| Year | Equatorial Guinea | Change, percent | Equatorial Guinea, percent of Africa | Equatorial Guinea, percent of World |
| 1980 | 0.000 | N/A | 0.00% | 0.00% |
| 1981 | 0.000 | 0.000% | 0.00% | 0.00% |
| 1982 | 0.000 | 0.000% | 0.00% | 0.00% |
| 1983 | 0.000 | 0.000% | 0.00% | 0.00% |
| 1984 | 0.000 | 0.000% | 0.00% | 0.00% |
| 1985 | 0.000 | 0.000% | 0.00% | 0.00% |
| 1986 | 0.000 | 0.000% | 0.00% | 0.00% |
| 1987 | 0.000 | 0.000% | 0.00% | 0.00% |
| 1988 | 0.000 | 0.000% | 0.00% | 0.00% |
| 1989 | 0.000 | 0.000% | 0.00% | 0.00% |
| 1990 | 0.000 | 0.000% | 0.00% | 0.00% |
| 1991 | 0.000 | 0.000% | 0.00% | 0.00% |
| 1992 | 0.000 | 0.000% | 0.00% | 0.00% |
| 1993 | 0.000 | 0.000% | 0.00% | 0.00% |
| 1994 | 0.000 | 0.000% | 0.00% | 0.00% |
| 1995 | 0.000 | 0.000% | 0.00% | 0.00% |
| 1996 | 0.000 | 0.000% | 0.00% | 0.00% |
| 1997 | 0.000 | 0.000% | 0.00% | 0.00% |
| 1998 | 0.700 | 0.000% | 0.019% | 0.001% |
| 1999 | 0.700 | 0.000% | 0.017% | 0.001% |
| 2000 | 1.100 | 57.143% | 0.025% | 0.001% |
| 2001 | 1.100 | 0.000% | 0.024% | 0.001% |
| 2002 | 45.000 | 3,990.909% | 0.961% | 0.050% |
| 2003 | 46.000 | 2.222% | 0.901% | 0.049% |
| 2004 | 3.500 | -92.391% | 0.066% | 0.004% |
| 2005 | 46.000 | 1,214.286% | 0.739% | 0.047% |
| 2006 | 46.000 | 0.000% | 0.699% | 0.045% |
| 2007 | 103.000 | 123.913% | 1.526% | 0.099% |
| 2008 | 210.000 | 103.883% | 2.809% | 0.195% |
| 2009 | 221.000 | 5.238% | 3.108% | 0.210% |
| 2010 | 238.000 | 7.692% | 3.226% | 0.212% |
| 2011 | 243.000 | 2.101% | 3.412% | 0.209% |
| 2012 | 225.000 | -7.407% | 2.880% | 0.189% |
| 2013 | 231.000 | 2.667% | 3.138% | 0.191% |
| 2014 | 231.000 | 0.000% | 3.139% | 0.189% |
Historical Energy Data about Equatorial Guinea
Total Oil Supply
Total Consumption of Petroleum Products
Oil and Petroleum Products, Net Exports/Imports (-)
Production of Crude Oil including Lease Condensate
Crude Oil Proved Reserves
Dry Natural Gas Production
Dry Natural Gas Consumption
Dry Natural Gas, Net Exports/Imports (-)
Proved Reserves of Natural Gas
Coal, Net Exports/Imports (-)
Total Electricity Net Generation
Total Electricity Net Consumption
Electricity, Net Exports/Imports (-)
Total Conventional Thermal Electricity Net Generation
Hydroelectricity Net Generation
Total Primary Energy Production
Total Primary Energy Consumption
Total Carbon Dioxide Emissions from the Consumption of Energy
Population