| Business / Energy Data |
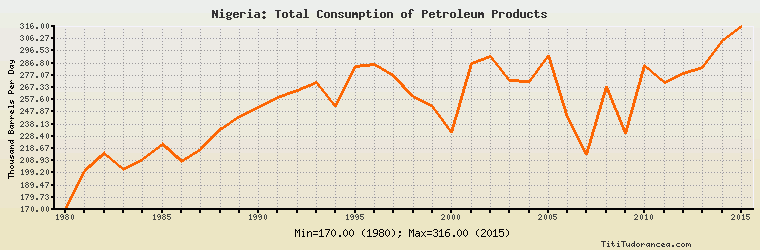
Nigeria: Total Consumption of Petroleum Products
Thousand Barrels Per Day
| Year | Nigeria | Change, percent | Nigeria, percent of Africa | Nigeria, percent of World |
| 1980 | 170.000 | N/A | 11.540% | 0.271% |
| 1981 | 200.000 | 17.647% | 12.679% | 0.328% |
| 1982 | 215.000 | 7.500% | 12.954% | 0.361% |
| 1983 | 202.000 | -6.047% | 11.901% | 0.344% |
| 1984 | 210.000 | 3.960% | 11.936% | 0.351% |
| 1985 | 222.000 | 5.714% | 12.148% | 0.369% |
| 1986 | 208.000 | -6.306% | 11.427% | 0.336% |
| 1987 | 218.000 | 4.808% | 11.858% | 0.345% |
| 1988 | 234.000 | 7.339% | 12.272% | 0.360% |
| 1989 | 244.000 | 4.274% | 12.319% | 0.369% |
| 1990 | 251.000 | 2.869% | 12.133% | 0.377% |
| 1991 | 259.000 | 3.187% | 12.233% | 0.385% |
| 1992 | 265.000 | 2.317% | 12.294% | 0.393% |
| 1993 | 271.000 | 2.264% | 12.448% | 0.401% |
| 1994 | 252.000 | -7.011% | 11.533% | 0.366% |
| 1995 | 284.000 | 12.698% | 12.608% | 0.405% |
| 1996 | 286.000 | 0.704% | 12.398% | 0.399% |
| 1997 | 277.000 | -3.147% | 11.675% | 0.377% |
| 1998 | 260.000 | -6.137% | 10.810% | 0.351% |
| 1999 | 252.000 | -3.077% | 10.284% | 0.332% |
| 2000 | 231.440 | -8.159% | 9.045% | 0.300% |
| 2001 | 286.822 | 23.929% | 10.945% | 0.369% |
| 2002 | 292.196 | 1.874% | 10.791% | 0.373% |
| 2003 | 273.197 | -6.502% | 9.915% | 0.341% |
| 2004 | 272.164 | -0.378% | 9.549% | 0.327% |
| 2005 | 292.880 | 7.612% | 9.861% | 0.346% |
| 2006 | 243.421 | -16.887% | 8.092% | 0.284% |
| 2007 | 213.820 | -12.160% | 7.005% | 0.247% |
| 2008 | 268.297 | 25.478% | 8.421% | 0.313% |
| 2009 | 230.731 | -14.002% | 6.906% | 0.270% |
| 2010 | 284.830 | 23.447% | 8.085% | 0.319% |
| 2011 | 271.026 | -4.846% | 7.867% | 0.302% |
| 2012 | 278.406 | 2.723% | 7.640% | 0.306% |
| 2013 | 283.127 | 1.696% | 7.433% | 0.307% |
| 2014 | 304.913 | 7.695% | 7.643% | 0.326% |
| 2015 | 316.000 | 3.636% | 7.899% | 0.331% |
Historical Energy Data about Nigeria
Total Oil Supply
Total Consumption of Petroleum Products
Oil and Petroleum Products, Net Exports/Imports (-)
Production of Crude Oil including Lease Condensate
Crude Oil Proved Reserves
Dry Natural Gas Production
Dry Natural Gas Consumption
Dry Natural Gas, Net Exports/Imports (-)
Proved Reserves of Natural Gas
Total Primary Coal Production
Total Coal Consumption
Coal, Net Exports/Imports (-)
Total Recoverable Coal
Total Electricity Net Generation
Total Electricity Net Consumption
Total Electricity Exports
Electricity, Net Exports/Imports (-)
Total Conventional Thermal Electricity Net Generation
Hydroelectricity Net Generation
Total Biofuels Consumption
Total Primary Energy Production
Total Primary Energy Consumption
Total Carbon Dioxide Emissions from the Consumption of Energy
Population