| Business / Energy Data |
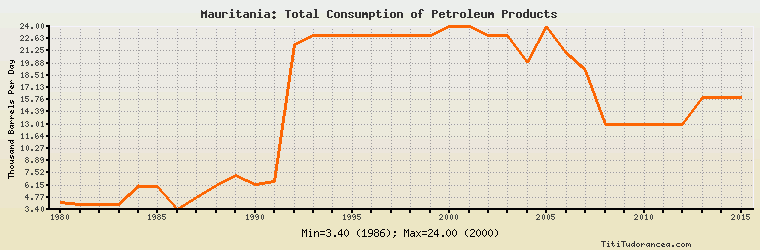
Mauritania: Total Consumption of Petroleum Products
Thousand Barrels Per Day
| Year | Mauritania | Change, percent | Mauritania, percent of Africa | Mauritania, percent of World |
| 1980 | 4.200 | N/A | 0.285% | 0.007% |
| 1981 | 4.000 | -4.762% | 0.254% | 0.007% |
| 1982 | 4.000 | 0.000% | 0.241% | 0.007% |
| 1983 | 4.000 | 0.000% | 0.236% | 0.007% |
| 1984 | 6.000 | 50.000% | 0.341% | 0.010% |
| 1985 | 6.000 | 0.000% | 0.328% | 0.010% |
| 1986 | 3.400 | -43.333% | 0.187% | 0.005% |
| 1987 | 4.700 | 38.235% | 0.256% | 0.007% |
| 1988 | 6.100 | 29.787% | 0.320% | 0.009% |
| 1989 | 7.200 | 18.033% | 0.364% | 0.011% |
| 1990 | 6.200 | -13.889% | 0.300% | 0.009% |
| 1991 | 6.600 | 6.452% | 0.312% | 0.010% |
| 1992 | 22.000 | 233.333% | 1.021% | 0.033% |
| 1993 | 23.000 | 4.545% | 1.056% | 0.034% |
| 1994 | 23.000 | 0.000% | 1.053% | 0.033% |
| 1995 | 23.000 | 0.000% | 1.021% | 0.033% |
| 1996 | 23.000 | 0.000% | 0.997% | 0.032% |
| 1997 | 23.000 | 0.000% | 0.969% | 0.031% |
| 1998 | 23.000 | 0.000% | 0.956% | 0.031% |
| 1999 | 23.000 | 0.000% | 0.939% | 0.030% |
| 2000 | 24.000 | 4.348% | 0.938% | 0.031% |
| 2001 | 24.000 | 0.000% | 0.916% | 0.031% |
| 2002 | 23.000 | -4.167% | 0.849% | 0.029% |
| 2003 | 23.000 | 0.000% | 0.835% | 0.029% |
| 2004 | 20.000 | -13.043% | 0.702% | 0.024% |
| 2005 | 24.000 | 20.000% | 0.808% | 0.028% |
| 2006 | 21.000 | -12.500% | 0.698% | 0.025% |
| 2007 | 19.000 | -9.524% | 0.622% | 0.022% |
| 2008 | 13.000 | -31.579% | 0.408% | 0.015% |
| 2009 | 13.000 | 0.000% | 0.389% | 0.015% |
| 2010 | 13.000 | 0.000% | 0.369% | 0.015% |
| 2011 | 13.000 | 0.000% | 0.377% | 0.014% |
| 2012 | 13.000 | 0.000% | 0.357% | 0.014% |
| 2013 | 16.000 | 23.077% | 0.420% | 0.017% |
| 2014 | 16.000 | 0.000% | 0.401% | 0.017% |
| 2015 | 16.000 | 0.000% | 0.400% | 0.017% |
Historical Energy Data about Mauritania
Total Oil Supply
Total Consumption of Petroleum Products
Oil and Petroleum Products, Net Exports/Imports (-)
Production of Crude Oil including Lease Condensate
Crude Oil Proved Reserves
Dry Natural Gas, Net Exports/Imports (-)
Proved Reserves of Natural Gas
Total Coal Consumption
Coal, Net Exports/Imports (-)
Total Electricity Net Generation
Total Electricity Net Consumption
Electricity, Net Exports/Imports (-)
Total Conventional Thermal Electricity Net Generation
Hydroelectricity Net Generation
Total Primary Energy Production
Total Primary Energy Consumption
Total Carbon Dioxide Emissions from the Consumption of Energy
Population