| Business / Energy Data |
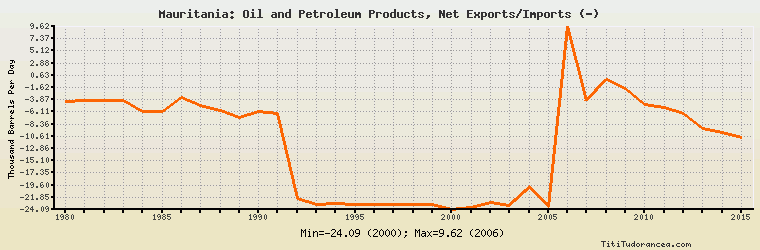
Mauritania: Oil and Petroleum Products, Net Exports/Imports (-)
Thousand Barrels Per Day
| Year | Mauritania | Change, percent | Mauritania, percent of Africa | Mauritania, percent of World |
| 1980 | -4.200 | N/A | -0.088% | N/A |
| 1981 | -4.000 | -4.762% | -0.121% | N/A |
| 1982 | -4.000 | 0.000% | -0.124% | N/A |
| 1983 | -4.000 | 0.000% | -0.124% | N/A |
| 1984 | -6.000 | 50.000% | -0.167% | N/A |
| 1985 | -6.000 | 0.000% | -0.159% | N/A |
| 1986 | -3.431 | -42.817% | -0.093% | N/A |
| 1987 | -5.000 | 45.730% | -0.136% | N/A |
| 1988 | -5.900 | 18.000% | -0.150% | N/A |
| 1989 | -7.100 | 20.339% | -0.166% | N/A |
| 1990 | -6.100 | -14.085% | -0.131% | N/A |
| 1991 | -6.500 | 6.557% | -0.134% | N/A |
| 1992 | -22.047 | 239.185% | -0.449% | N/A |
| 1993 | -23.100 | 4.776% | -0.475% | N/A |
| 1994 | -23.060 | -0.173% | -0.475% | N/A |
| 1995 | -23.097 | 0.160% | -0.456% | N/A |
| 1996 | -23.095 | -0.009% | -0.443% | N/A |
| 1997 | -23.096 | 0.004% | -0.424% | N/A |
| 1998 | -23.098 | 0.009% | -0.429% | N/A |
| 1999 | -23.098 | 0.000% | -0.437% | N/A |
| 2000 | -24.093 | 4.308% | -0.444% | N/A |
| 2001 | -23.737 | -1.478% | -0.439% | N/A |
| 2002 | -22.745 | -4.179% | -0.419% | N/A |
| 2003 | -23.300 | 2.440% | -0.398% | N/A |
| 2004 | -19.959 | -14.339% | -0.308% | N/A |
| 2005 | -23.519 | 17.837% | -0.330% | N/A |
| 2006 | 9.619 | -140.899% | 0.134% | N/A |
| 2007 | -4.008 | -141.668% | -0.054% | N/A |
| 2008 | -0.167 | -95.833% | -0.002% | N/A |
| 2009 | -1.755 | 950.898% | -0.025% | N/A |
| 2010 | -4.768 | 171.681% | -0.067% | N/A |
| 2011 | -5.262 | 10.361% | -0.090% | N/A |
| 2012 | -6.423 | 22.064% | -0.102% | N/A |
| 2013 | -9.250 | 44.014% | -0.170% | N/A |
| 2014 | -9.997 | 8.076% | -0.210% | N/A |
| 2015 | -10.753 | 7.562% | -0.232% | N/A |
Historical Energy Data about Mauritania
Total Oil Supply
Total Consumption of Petroleum Products
Oil and Petroleum Products, Net Exports/Imports (-)
Production of Crude Oil including Lease Condensate
Crude Oil Proved Reserves
Dry Natural Gas, Net Exports/Imports (-)
Proved Reserves of Natural Gas
Total Coal Consumption
Coal, Net Exports/Imports (-)
Total Electricity Net Generation
Total Electricity Net Consumption
Electricity, Net Exports/Imports (-)
Total Conventional Thermal Electricity Net Generation
Hydroelectricity Net Generation
Total Primary Energy Production
Total Primary Energy Consumption
Total Carbon Dioxide Emissions from the Consumption of Energy
Population