| Business / Energy Data |
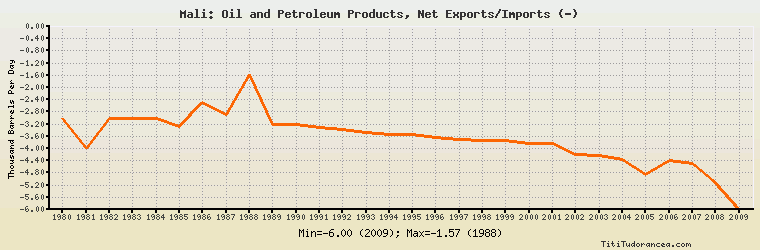
Mali: Oil and Petroleum Products, Net Exports/Imports (-)
Thousand Barrels Per Day
| Year | Mali | Change, percent | Mali, percent of Africa | Mali, percent of World |
| 1980 | -3.000 | N/A | -0.063% | N/A |
| 1981 | -4.000 | 33.333% | -0.121% | N/A |
| 1982 | -3.000 | -25.000% | -0.093% | N/A |
| 1983 | -3.000 | 0.000% | -0.093% | N/A |
| 1984 | -3.000 | 0.000% | -0.084% | N/A |
| 1985 | -3.288 | 9.600% | -0.087% | N/A |
| 1986 | -2.491 | -24.240% | -0.067% | N/A |
| 1987 | -2.900 | 16.419% | -0.079% | N/A |
| 1988 | -1.569 | -45.897% | -0.040% | N/A |
| 1989 | -3.228 | 105.736% | -0.076% | N/A |
| 1990 | -3.208 | -0.620% | -0.069% | N/A |
| 1991 | -3.318 | 3.429% | -0.069% | N/A |
| 1992 | -3.371 | 1.597% | -0.069% | N/A |
| 1993 | -3.486 | 3.411% | -0.072% | N/A |
| 1994 | -3.555 | 1.979% | -0.073% | N/A |
| 1995 | -3.553 | -0.056% | -0.070% | N/A |
| 1996 | -3.625 | 2.026% | -0.070% | N/A |
| 1997 | -3.696 | 1.959% | -0.068% | N/A |
| 1998 | -3.742 | 1.245% | -0.070% | N/A |
| 1999 | -3.742 | 0.000% | -0.071% | N/A |
| 2000 | -3.841 | 2.646% | -0.071% | N/A |
| 2001 | -3.851 | 0.260% | -0.071% | N/A |
| 2002 | -4.202 | 9.115% | -0.077% | N/A |
| 2003 | -4.241 | 0.928% | -0.072% | N/A |
| 2004 | -4.369 | 3.018% | -0.068% | N/A |
| 2005 | -4.860 | 11.238% | -0.068% | N/A |
| 2006 | -4.402 | -9.424% | -0.061% | N/A |
| 2007 | -4.507 | 2.385% | -0.061% | N/A |
| 2008 | -5.100 | 13.157% | -0.069% | N/A |
| 2009 | -6.000 | 17.647% | -0.085% | N/A |
Historical Energy Data about Mali
Total Consumption of Petroleum Products
Oil and Petroleum Products, Net Exports/Imports (-)
Dry Natural Gas, Net Exports/Imports (-)
Coal, Net Exports/Imports (-)
Total Electricity Net Generation
Total Electricity Net Consumption
Electricity, Net Exports/Imports (-)
Total Conventional Thermal Electricity Net Generation
Hydroelectricity Net Generation
Total Primary Energy Production
Total Primary Energy Consumption
Total Carbon Dioxide Emissions from the Consumption of Energy
Population