| Business / Energy Data |
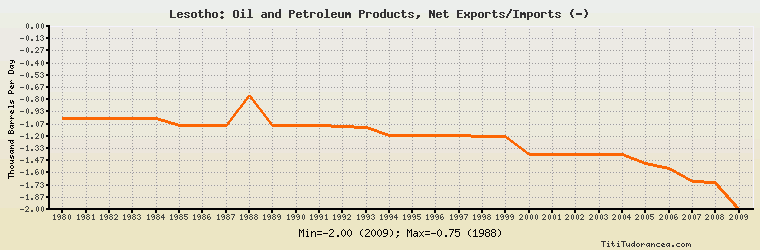
Lesotho: Oil and Petroleum Products, Net Exports/Imports (-)
Thousand Barrels Per Day
| Year | Lesotho | Change, percent | Lesotho, percent of Africa | Lesotho, percent of World |
| 1980 | -1.000 | N/A | -0.021% | N/A |
| 1981 | -1.000 | 0.000% | -0.030% | N/A |
| 1982 | -1.000 | 0.000% | -0.031% | N/A |
| 1983 | -1.000 | 0.000% | -0.031% | N/A |
| 1984 | -1.000 | 0.000% | -0.028% | N/A |
| 1985 | -1.077 | 7.700% | -0.029% | N/A |
| 1986 | -1.077 | 0.000% | -0.029% | N/A |
| 1987 | -1.077 | 0.000% | -0.029% | N/A |
| 1988 | -0.749 | -30.455% | -0.019% | N/A |
| 1989 | -1.077 | 43.792% | -0.025% | N/A |
| 1990 | -1.077 | 0.000% | -0.023% | N/A |
| 1991 | -1.077 | 0.000% | -0.022% | N/A |
| 1992 | -1.096 | 1.764% | -0.022% | N/A |
| 1993 | -1.100 | 0.365% | -0.023% | N/A |
| 1994 | -1.190 | 8.182% | -0.025% | N/A |
| 1995 | -1.190 | 0.000% | -0.023% | N/A |
| 1996 | -1.190 | 0.000% | -0.023% | N/A |
| 1997 | -1.190 | 0.000% | -0.022% | N/A |
| 1998 | -1.200 | 0.840% | -0.022% | N/A |
| 1999 | -1.200 | 0.000% | -0.023% | N/A |
| 2000 | -1.400 | 16.667% | -0.026% | N/A |
| 2001 | -1.400 | 0.000% | -0.026% | N/A |
| 2002 | -1.400 | 0.000% | -0.026% | N/A |
| 2003 | -1.400 | 0.000% | -0.024% | N/A |
| 2004 | -1.400 | 0.000% | -0.022% | N/A |
| 2005 | -1.500 | 7.143% | -0.021% | N/A |
| 2006 | -1.553 | 3.533% | -0.022% | N/A |
| 2007 | -1.690 | 8.822% | -0.023% | N/A |
| 2008 | -1.700 | 0.592% | -0.023% | N/A |
| 2009 | -2.000 | 17.647% | -0.028% | N/A |
Historical Energy Data about Lesotho
Total Consumption of Petroleum Products
Oil and Petroleum Products, Net Exports/Imports (-)
Dry Natural Gas, Net Exports/Imports (-)
Coal, Net Exports/Imports (-)
Total Electricity Net Generation
Total Electricity Net Consumption
Total Electricity Imports
Electricity, Net Exports/Imports (-)
Hydroelectricity Net Generation
Total Primary Energy Production
Total Primary Energy Consumption
Total Carbon Dioxide Emissions from the Consumption of Energy
Population