| Business / Energy Data |
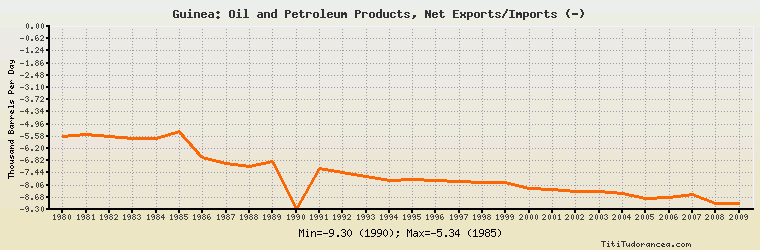
Guinea: Oil and Petroleum Products, Net Exports/Imports (-)
Thousand Barrels Per Day
| Year | Guinea | Change, percent | Guinea, percent of Africa | Guinea, percent of World |
| 1980 | -5.600 | N/A | -0.118% | N/A |
| 1981 | -5.500 | -1.786% | -0.166% | N/A |
| 1982 | -5.600 | 1.818% | -0.174% | N/A |
| 1983 | -5.700 | 1.786% | -0.177% | N/A |
| 1984 | -5.700 | 0.000% | -0.159% | N/A |
| 1985 | -5.336 | -6.386% | -0.141% | N/A |
| 1986 | -6.632 | 24.288% | -0.179% | N/A |
| 1987 | -6.949 | 4.780% | -0.190% | N/A |
| 1988 | -7.118 | 2.432% | -0.181% | N/A |
| 1989 | -6.871 | -3.470% | -0.161% | N/A |
| 1990 | -9.298 | 35.322% | -0.200% | N/A |
| 1991 | -7.196 | -22.607% | -0.149% | N/A |
| 1992 | -7.411 | 2.988% | -0.151% | N/A |
| 1993 | -7.625 | 2.888% | -0.157% | N/A |
| 1994 | -7.844 | 2.872% | -0.162% | N/A |
| 1995 | -7.769 | -0.956% | -0.153% | N/A |
| 1996 | -7.841 | 0.927% | -0.150% | N/A |
| 1997 | -7.862 | 0.268% | -0.144% | N/A |
| 1998 | -7.907 | 0.572% | -0.147% | N/A |
| 1999 | -7.907 | 0.000% | -0.150% | N/A |
| 2000 | -8.212 | 3.857% | -0.151% | N/A |
| 2001 | -8.304 | 1.120% | -0.154% | N/A |
| 2002 | -8.362 | 0.698% | -0.154% | N/A |
| 2003 | -8.403 | 0.490% | -0.144% | N/A |
| 2004 | -8.481 | 0.928% | -0.131% | N/A |
| 2005 | -8.744 | 3.101% | -0.123% | N/A |
| 2006 | -8.674 | -0.801% | -0.121% | N/A |
| 2007 | -8.559 | -1.326% | -0.115% | N/A |
| 2008 | -9.000 | 5.152% | -0.122% | N/A |
| 2009 | -9.000 | 0.000% | -0.127% | N/A |
Historical Energy Data about Guinea
Total Consumption of Petroleum Products
Oil and Petroleum Products, Net Exports/Imports (-)
Dry Natural Gas, Net Exports/Imports (-)
Coal, Net Exports/Imports (-)
Total Electricity Net Generation
Total Electricity Net Consumption
Electricity, Net Exports/Imports (-)
Total Conventional Thermal Electricity Net Generation
Hydroelectricity Net Generation
Total Primary Energy Production
Total Primary Energy Consumption
Total Carbon Dioxide Emissions from the Consumption of Energy
Population