| Business / Energy Data |
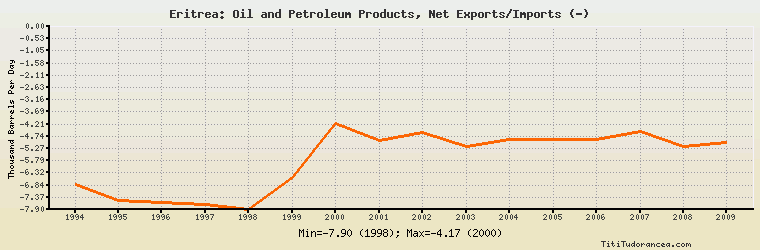
Eritrea: Oil and Petroleum Products, Net Exports/Imports (-)
Thousand Barrels Per Day
| Year | Eritrea | Change, percent | Eritrea, percent of Africa | Eritrea, percent of World |
| 1994 | -6.800 | N/A | -0.140% | N/A |
| 1995 | -7.500 | 10.294% | -0.148% | N/A |
| 1996 | -7.600 | 1.333% | -0.146% | N/A |
| 1997 | -7.700 | 1.316% | -0.142% | N/A |
| 1998 | -7.898 | 2.571% | -0.147% | N/A |
| 1999 | -6.530 | -17.321% | -0.124% | N/A |
| 2000 | -4.165 | -36.217% | -0.077% | N/A |
| 2001 | -4.929 | 18.343% | -0.091% | N/A |
| 2002 | -4.589 | -6.898% | -0.085% | N/A |
| 2003 | -5.183 | 12.944% | -0.089% | N/A |
| 2004 | -4.870 | -6.039% | -0.075% | N/A |
| 2005 | -4.872 | 0.041% | -0.068% | N/A |
| 2006 | -4.864 | -0.164% | -0.068% | N/A |
| 2007 | -4.522 | -7.031% | -0.061% | N/A |
| 2008 | -5.200 | 14.993% | -0.070% | N/A |
| 2009 | -5.000 | -3.846% | -0.070% | N/A |
Historical Energy Data about Eritrea
Total Oil Supply
Total Consumption of Petroleum Products
Oil and Petroleum Products, Net Exports/Imports (-)
Dry Natural Gas, Net Exports/Imports (-)
Coal, Net Exports/Imports (-)
Total Electricity Net Generation
Total Electricity Net Consumption
Electricity, Net Exports/Imports (-)
Total Conventional Thermal Electricity Net Generation
Solar, Tide and Wave Electricity Net Generation
Total Primary Energy Consumption
Total Carbon Dioxide Emissions from the Consumption of Energy
Population