| Business / Energy Data |
Eritrea: Total Electricity Net Consumption
Billion Kilowatthours
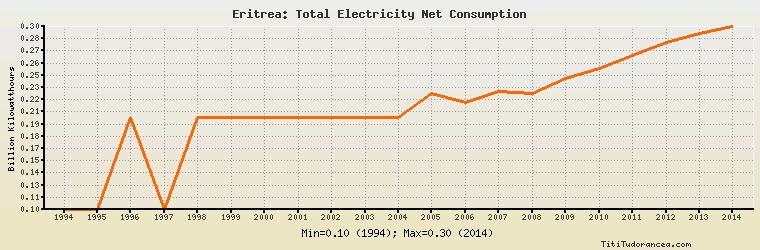
| Year | Eritrea | Change, percent | Eritrea, percent of Africa | Eritrea, percent of World |
| 1980 | N/A | N/A | N/A | N/A |
| 1981 | N/A | N/A | N/A | N/A |
| 1982 | N/A | N/A | N/A | N/A |
| 1983 | N/A | N/A | N/A | N/A |
| 1984 | N/A | N/A | N/A | N/A |
| 1985 | N/A | N/A | N/A | N/A |
| 1986 | N/A | N/A | N/A | N/A |
| 1987 | N/A | N/A | N/A | N/A |
| 1988 | N/A | N/A | N/A | N/A |
| 1989 | N/A | N/A | N/A | N/A |
| 1990 | N/A | N/A | N/A | N/A |
| 1991 | N/A | N/A | N/A | N/A |
| 1992 | N/A | N/A | N/A | N/A |
| 1993 | N/A | N/A | N/A | N/A |
| 1994 | 0.100 | N/A | 0.033% | 0.001% |
| 1995 | 0.100 | 0.000% | 0.032% | 0.001% |
| 1996 | 0.200 | 100.000% | 0.062% | 0.002% |
| 1997 | 0.100 | -50.000% | 0.030% | 0.001% |
| 1998 | 0.200 | 100.000% | 0.059% | 0.002% |
| 1999 | 0.200 | 0.000% | 0.057% | 0.002% |
| 2000 | 0.200 | 0.000% | 0.054% | 0.002% |
| 2001 | 0.200 | 0.000% | 0.052% | 0.001% |
| 2002 | 0.200 | 0.000% | 0.049% | 0.001% |
| 2003 | 0.200 | 0.000% | 0.047% | 0.001% |
| 2004 | 0.200 | 0.000% | 0.045% | 0.001% |
| 2005 | 0.225 | 12.500% | 0.048% | 0.001% |
| 2006 | 0.216 | -4.000% | 0.044% | 0.001% |
| 2007 | 0.228 | 5.556% | 0.044% | 0.001% |
| 2008 | 0.225 | -1.316% | 0.043% | 0.001% |
| 2009 | 0.242 | 7.556% | 0.046% | 0.001% |
| 2010 | 0.253 | 4.545% | 0.046% | 0.001% |
| 2011 | 0.267 | 5.534% | 0.046% | 0.001% |
| 2012 | 0.281 | 5.243% | 0.048% | 0.001% |
| 2013 | 0.290 | 3.203% | 0.048% | 0.001% |
| 2014 | 0.298 | 2.759% | 0.048% | 0.001% |
Historical Energy Data about Eritrea
Total Oil Supply
Total Consumption of Petroleum Products
Oil and Petroleum Products, Net Exports/Imports (-)
Dry Natural Gas, Net Exports/Imports (-)
Coal, Net Exports/Imports (-)
Total Electricity Net Generation
Total Electricity Net Consumption
Electricity, Net Exports/Imports (-)
Total Conventional Thermal Electricity Net Generation
Solar, Tide and Wave Electricity Net Generation
Total Primary Energy Consumption
Total Carbon Dioxide Emissions from the Consumption of Energy
Population