| Business / Energy Data |
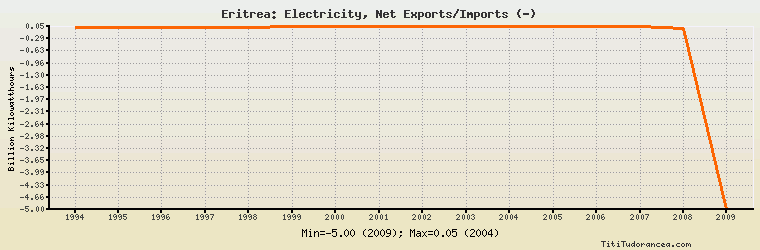
Eritrea: Electricity, Net Exports/Imports (-)
Billion Kilowatthours
| Year | Eritrea | Change, percent | Eritrea, percent of Africa | Eritrea, percent of World |
| 1994 | 0.020 | N/A | -15.873% | N/A |
| 1995 | 0.024 | 20.000% | 5.275% | N/A |
| 1996 | 0.024 | 0.000% | 1.354% | N/A |
| 1997 | 0.029 | 20.833% | 1.839% | N/A |
| 1998 | 0.032 | 10.345% | -0.908% | N/A |
| 1999 | 0.038 | 18.750% | -1.542% | N/A |
| 2000 | 0.038 | 0.000% | -1.011% | N/A |
| 2001 | 0.039 | 2.632% | -1.417% | N/A |
| 2002 | 0.043 | 10.256% | -2.368% | N/A |
| 2003 | 0.044 | 2.326% | -1.404% | N/A |
| 2004 | 0.048 | 9.091% | -2.925% | N/A |
| 2005 | 0.046 | -4.167% | -2.080% | N/A |
| 2006 | 0.037 | -19.565% | -0.911% | N/A |
| 2007 | 0.043 | 16.216% | -0.938% | N/A |
| 2008 | 0.000 | -100.000% | 0.00% | N/A |
| 2009 | -5.000 | 0.000% | 116.009% | N/A |
Historical Energy Data about Eritrea
Total Oil Supply
Total Consumption of Petroleum Products
Oil and Petroleum Products, Net Exports/Imports (-)
Dry Natural Gas, Net Exports/Imports (-)
Coal, Net Exports/Imports (-)
Total Electricity Net Generation
Total Electricity Net Consumption
Electricity, Net Exports/Imports (-)
Total Conventional Thermal Electricity Net Generation
Solar, Tide and Wave Electricity Net Generation
Total Primary Energy Consumption
Total Carbon Dioxide Emissions from the Consumption of Energy
Population