| Business / Energy Data |
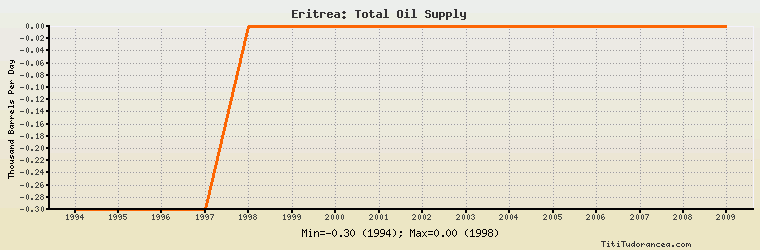
Eritrea: Total Oil Supply
Thousand Barrels Per Day
| Year | Eritrea | Change, percent | Eritrea, percent of Africa | Eritrea, percent of World |
| 1980 | N/A | N/A | N/A | N/A |
| 1981 | N/A | N/A | N/A | N/A |
| 1982 | N/A | N/A | N/A | N/A |
| 1983 | N/A | N/A | N/A | N/A |
| 1984 | N/A | N/A | N/A | N/A |
| 1985 | N/A | N/A | N/A | N/A |
| 1986 | N/A | N/A | N/A | N/A |
| 1987 | N/A | N/A | N/A | N/A |
| 1988 | N/A | N/A | N/A | N/A |
| 1989 | N/A | N/A | N/A | N/A |
| 1990 | N/A | N/A | N/A | N/A |
| 1991 | N/A | N/A | N/A | N/A |
| 1992 | N/A | N/A | N/A | N/A |
| 1993 | N/A | N/A | N/A | N/A |
| 1994 | -0.300 | N/A | -0.004% | -0.000% |
| 1995 | -0.300 | 0.000% | -0.004% | -0.000% |
| 1996 | -0.300 | 0.000% | -0.004% | -0.000% |
| 1997 | -0.300 | 0.000% | -0.004% | -0.000% |
| 1998 | 0.000 | -100.000% | 0.00% | 0.00% |
| 1999 | 0.000 | 0.000% | 0.00% | 0.00% |
| 2000 | 0.000 | 0.000% | 0.00% | 0.00% |
| 2001 | 0.000 | 0.000% | 0.00% | 0.00% |
| 2002 | 0.000 | 0.000% | 0.00% | 0.00% |
| 2003 | 0.000 | 0.000% | 0.00% | 0.00% |
| 2004 | 0.000 | 0.000% | 0.00% | 0.00% |
| 2005 | 0.000 | 0.000% | 0.00% | 0.00% |
| 2006 | 0.000 | 0.000% | 0.00% | 0.00% |
| 2007 | 0.000 | 0.000% | 0.00% | 0.00% |
| 2008 | 0.000 | 0.000% | 0.00% | 0.00% |
| 2009 | 0.000 | 0.000% | 0.00% | 0.00% |
| 2010 | N/A | N/A | N/A | N/A |
Historical Energy Data about Eritrea
Total Oil Supply
Total Consumption of Petroleum Products
Oil and Petroleum Products, Net Exports/Imports (-)
Dry Natural Gas, Net Exports/Imports (-)
Coal, Net Exports/Imports (-)
Total Electricity Net Generation
Total Electricity Net Consumption
Electricity, Net Exports/Imports (-)
Total Conventional Thermal Electricity Net Generation
Solar, Tide and Wave Electricity Net Generation
Total Primary Energy Consumption
Total Carbon Dioxide Emissions from the Consumption of Energy
Population