| Business / Energy Data |
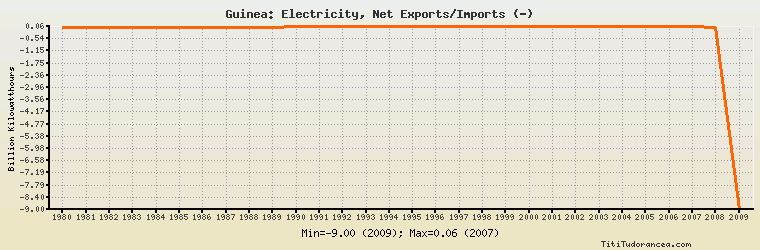
Guinea: Electricity, Net Exports/Imports (-)
Billion Kilowatthours
| Year | Guinea | Change, percent | Guinea, percent of Africa | Guinea, percent of World |
| 1980 | 0.025 | N/A | - | N/A |
| 1981 | 0.026 | 4.000% | - | N/A |
| 1982 | 0.026 | 0.000% | -288.889% | N/A |
| 1983 | 0.027 | 3.846% | -9.712% | N/A |
| 1984 | 0.032 | 18.519% | -62.745% | N/A |
| 1985 | 0.033 | 3.125% | - | N/A |
| 1986 | 0.033 | 0.000% | -28.696% | N/A |
| 1987 | 0.033 | 0.000% | -16.500% | N/A |
| 1988 | 0.034 | 3.030% | -12.687% | N/A |
| 1989 | 0.034 | 0.000% | -34.694% | N/A |
| 1990 | 0.035 | 2.941% | -7.172% | N/A |
| 1991 | 0.035 | 0.000% | -14.957% | N/A |
| 1992 | 0.035 | 0.000% | 23.649% | N/A |
| 1993 | 0.035 | 0.000% | -68.627% | N/A |
| 1994 | 0.036 | 2.857% | -28.571% | N/A |
| 1995 | 0.037 | 2.778% | 8.132% | N/A |
| 1996 | 0.037 | 0.000% | 2.087% | N/A |
| 1997 | 0.043 | 16.216% | 2.727% | N/A |
| 1998 | 0.045 | 4.651% | -1.276% | N/A |
| 1999 | 0.051 | 13.333% | -2.070% | N/A |
| 2000 | 0.052 | 1.961% | -1.384% | N/A |
| 2001 | 0.054 | 3.846% | -1.962% | N/A |
| 2002 | 0.054 | 0.000% | -2.974% | N/A |
| 2003 | 0.053 | -1.852% | -1.691% | N/A |
| 2004 | 0.054 | 1.887% | -3.291% | N/A |
| 2005 | 0.055 | 1.852% | -2.486% | N/A |
| 2006 | 0.057 | 3.636% | -1.403% | N/A |
| 2007 | 0.059 | 3.509% | -1.288% | N/A |
| 2008 | 0.000 | -100.000% | 0.00% | N/A |
| 2009 | -9.000 | 0.000% | 208.817% | N/A |
Historical Energy Data about Guinea
Total Consumption of Petroleum Products
Oil and Petroleum Products, Net Exports/Imports (-)
Dry Natural Gas, Net Exports/Imports (-)
Coal, Net Exports/Imports (-)
Total Electricity Net Generation
Total Electricity Net Consumption
Electricity, Net Exports/Imports (-)
Total Conventional Thermal Electricity Net Generation
Hydroelectricity Net Generation
Total Primary Energy Production
Total Primary Energy Consumption
Total Carbon Dioxide Emissions from the Consumption of Energy
Population