| Business / Energy Data |
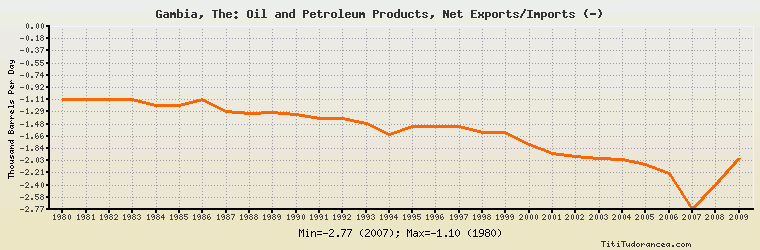
Gambia, The: Oil and Petroleum Products, Net Exports/Imports (-)
Thousand Barrels Per Day
| Year | Gambia, The | Change, percent | Gambia, The, percent of Africa | Gambia, The, percent of World |
| 1980 | -1.100 | N/A | -0.023% | N/A |
| 1981 | -1.100 | 0.000% | -0.033% | N/A |
| 1982 | -1.100 | 0.000% | -0.034% | N/A |
| 1983 | -1.100 | 0.000% | -0.034% | N/A |
| 1984 | -1.200 | 9.091% | -0.033% | N/A |
| 1985 | -1.191 | -0.750% | -0.032% | N/A |
| 1986 | -1.110 | -6.801% | -0.030% | N/A |
| 1987 | -1.278 | 15.135% | -0.035% | N/A |
| 1988 | -1.319 | 3.208% | -0.034% | N/A |
| 1989 | -1.302 | -1.289% | -0.030% | N/A |
| 1990 | -1.328 | 1.997% | -0.029% | N/A |
| 1991 | -1.387 | 4.443% | -0.029% | N/A |
| 1992 | -1.383 | -0.288% | -0.028% | N/A |
| 1993 | -1.472 | 6.435% | -0.030% | N/A |
| 1994 | -1.625 | 10.394% | -0.033% | N/A |
| 1995 | -1.516 | -6.708% | -0.030% | N/A |
| 1996 | -1.512 | -0.264% | -0.029% | N/A |
| 1997 | -1.516 | 0.265% | -0.028% | N/A |
| 1998 | -1.604 | 5.805% | -0.030% | N/A |
| 1999 | -1.604 | 0.000% | -0.030% | N/A |
| 2000 | -1.790 | 11.596% | -0.033% | N/A |
| 2001 | -1.917 | 7.095% | -0.035% | N/A |
| 2002 | -1.967 | 2.608% | -0.036% | N/A |
| 2003 | -1.990 | 1.169% | -0.034% | N/A |
| 2004 | -2.008 | 0.905% | -0.031% | N/A |
| 2005 | -2.082 | 3.685% | -0.029% | N/A |
| 2006 | -2.225 | 6.868% | -0.031% | N/A |
| 2007 | -2.766 | 24.315% | -0.037% | N/A |
| 2008 | -2.400 | -13.232% | -0.032% | N/A |
| 2009 | -2.000 | -16.667% | -0.028% | N/A |
Historical Energy Data about Gambia, The
Total Consumption of Petroleum Products
Oil and Petroleum Products, Net Exports/Imports (-)
Dry Natural Gas, Net Exports/Imports (-)
Coal, Net Exports/Imports (-)
Total Electricity Net Generation
Total Electricity Net Consumption
Electricity, Net Exports/Imports (-)
Total Conventional Thermal Electricity Net Generation
Total Primary Energy Consumption
Total Carbon Dioxide Emissions from the Consumption of Energy
Population