| Business / Energy Data |
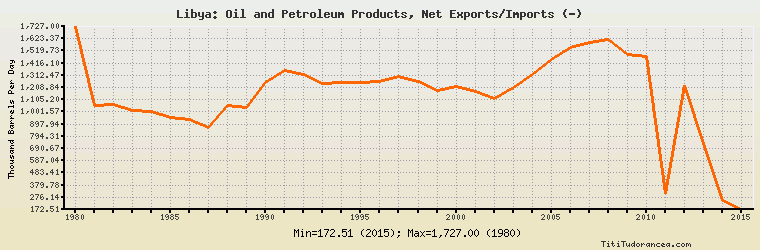
Libya: Oil and Petroleum Products, Net Exports/Imports (-)
Thousand Barrels Per Day
| Year | Libya | Change, percent | Libya, percent of Africa | Libya, percent of World |
| 1980 | 1,727.000 | N/A | 36.314% | N/A |
| 1981 | 1,060.000 | -38.622% | 32.018% | N/A |
| 1982 | 1,066.000 | 0.566% | 33.082% | N/A |
| 1983 | 1,010.000 | -5.253% | 31.331% | N/A |
| 1984 | 1,004.000 | -0.594% | 27.970% | N/A |
| 1985 | 957.000 | -4.681% | 25.375% | N/A |
| 1986 | 937.000 | -2.090% | 25.274% | N/A |
| 1987 | 865.000 | -7.684% | 23.607% | N/A |
| 1988 | 1,060.000 | 22.543% | 26.934% | N/A |
| 1989 | 1,036.000 | -2.264% | 24.241% | N/A |
| 1990 | 1,252.000 | 20.849% | 26.926% | N/A |
| 1991 | 1,355.000 | 8.227% | 28.003% | N/A |
| 1992 | 1,320.000 | -2.583% | 26.855% | N/A |
| 1993 | 1,240.000 | -6.061% | 25.509% | N/A |
| 1994 | 1,250.000 | 0.806% | 25.759% | N/A |
| 1995 | 1,249.000 | -0.080% | 24.662% | N/A |
| 1996 | 1,260.000 | 0.881% | 24.161% | N/A |
| 1997 | 1,305.000 | 3.571% | 23.984% | N/A |
| 1998 | 1,261.000 | -3.372% | 23.425% | N/A |
| 1999 | 1,185.000 | -6.027% | 22.434% | N/A |
| 2000 | 1,214.186 | 2.463% | 22.357% | N/A |
| 2001 | 1,172.125 | -3.464% | 21.676% | N/A |
| 2002 | 1,119.585 | -4.482% | 20.627% | N/A |
| 2003 | 1,211.847 | 8.241% | 20.714% | N/A |
| 2004 | 1,321.241 | 9.027% | 20.417% | N/A |
| 2005 | 1,445.711 | 9.421% | 20.310% | N/A |
| 2006 | 1,546.790 | 6.992% | 21.524% | N/A |
| 2007 | 1,594.722 | 3.099% | 21.455% | N/A |
| 2008 | 1,614.565 | 1.244% | 21.839% | N/A |
| 2009 | 1,487.717 | -7.856% | 20.974% | N/A |
| 2010 | 1,470.243 | -1.175% | 20.545% | N/A |
| 2011 | 310.416 | -78.887% | 5.325% | N/A |
| 2012 | 1,226.826 | 295.220% | 19.564% | N/A |
| 2013 | 731.668 | -40.361% | 13.420% | N/A |
| 2014 | 246.049 | -66.371% | 5.176% | N/A |
| 2015 | 172.512 | -29.887% | 3.715% | N/A |
Historical Energy Data about Libya
Total Oil Supply
Total Consumption of Petroleum Products
Oil and Petroleum Products, Net Exports/Imports (-)
Production of Crude Oil including Lease Condensate
Crude Oil Proved Reserves
Dry Natural Gas Production
Dry Natural Gas Consumption
Dry Natural Gas, Net Exports/Imports (-)
Proved Reserves of Natural Gas
Total Coal Consumption
Coal, Net Exports/Imports (-)
Total Electricity Net Generation
Total Electricity Net Consumption
Total Electricity Exports
Total Electricity Imports
Electricity, Net Exports/Imports (-)
Total Conventional Thermal Electricity Net Generation
Total Primary Energy Production
Total Primary Energy Consumption
Total Carbon Dioxide Emissions from the Consumption of Energy
Population