| Business / Demographics |
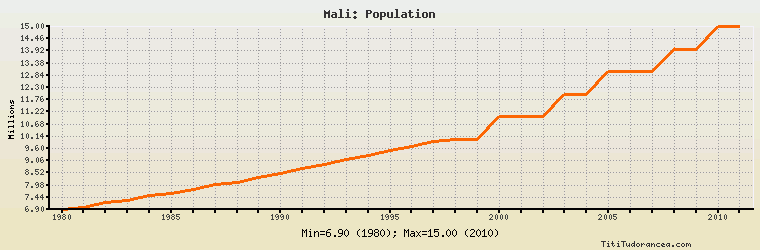
Mali: Population
Millions
| Year | Mali | Change, percent | Mali, percent of Africa | Mali, percent of World |
| 1980 | 6.900 | N/A | 1.454% | 0.155% |
| 1981 | 7.000 | 1.449% | 1.435% | 0.155% |
| 1982 | 7.200 | 2.857% | 1.420% | 0.156% |
| 1983 | 7.300 | 1.389% | 1.405% | 0.156% |
| 1984 | 7.500 | 2.740% | 1.410% | 0.157% |
| 1985 | 7.600 | 1.333% | 1.387% | 0.157% |
| 1986 | 7.800 | 2.632% | 1.386% | 0.158% |
| 1987 | 8.000 | 2.564% | 1.383% | 0.159% |
| 1988 | 8.100 | 1.250% | 1.361% | 0.159% |
| 1989 | 8.300 | 2.469% | 1.358% | 0.160% |
| 1990 | 8.500 | 2.410% | 1.354% | 0.161% |
| 1991 | 8.700 | 2.353% | 1.352% | 0.162% |
| 1992 | 8.900 | 2.299% | 1.347% | 0.163% |
| 1993 | 9.100 | 2.247% | 1.346% | 0.164% |
| 1994 | 9.300 | 2.198% | 1.336% | 0.166% |
| 1995 | 9.500 | 2.151% | 1.330% | 0.167% |
| 1996 | 9.700 | 2.105% | 1.326% | 0.168% |
| 1997 | 9.900 | 2.062% | 1.325% | 0.169% |
| 1998 | 10.000 | 1.010% | 1.308% | 0.168% |
| 1999 | 10.000 | 0.000% | 1.275% | 0.166% |
| 2000 | 11.000 | 10.000% | 1.367% | 0.181% |
| 2001 | 11.000 | 0.000% | 1.339% | 0.179% |
| 2002 | 11.000 | 0.000% | 1.303% | 0.176% |
| 2003 | 12.000 | 9.091% | 1.388% | 0.190% |
| 2004 | 12.000 | 0.000% | 1.352% | 0.188% |
| 2005 | 13.000 | 8.333% | 1.430% | 0.201% |
| 2006 | 13.000 | 0.000% | 1.394% | 0.198% |
| 2007 | 13.000 | 0.000% | 1.365% | 0.196% |
| 2008 | 14.000 | 7.692% | 1.435% | 0.209% |
| 2009 | 14.000 | 0.000% | 1.399% | 0.206% |
| 2010 | 15.000 | 7.143% | 1.462% | 0.219% |
| 2011 | 15.000 | 0.000% | 1.424% | 0.216% |
Historical Energy Data about Mali
Total Consumption of Petroleum Products
Oil and Petroleum Products, Net Exports/Imports (-)
Dry Natural Gas, Net Exports/Imports (-)
Coal, Net Exports/Imports (-)
Total Electricity Net Generation
Total Electricity Net Consumption
Electricity, Net Exports/Imports (-)
Total Conventional Thermal Electricity Net Generation
Hydroelectricity Net Generation
Total Primary Energy Production
Total Primary Energy Consumption
Total Carbon Dioxide Emissions from the Consumption of Energy
Population