| Business / Energy Data |
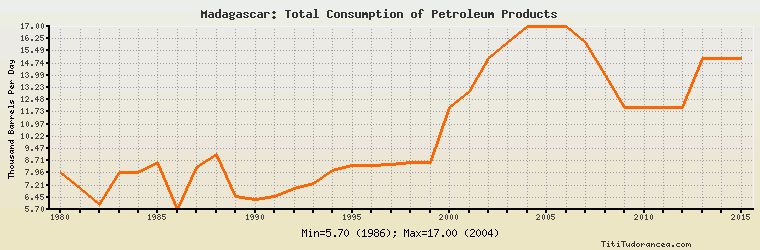
Madagascar: Total Consumption of Petroleum Products
Thousand Barrels Per Day
| Year | Madagascar | Change, percent | Madagascar, percent of Africa | Madagascar, percent of World |
| 1980 | 8.000 | N/A | 0.543% | 0.013% |
| 1981 | 7.000 | -12.500% | 0.444% | 0.011% |
| 1982 | 6.000 | -14.286% | 0.362% | 0.010% |
| 1983 | 8.000 | 33.333% | 0.471% | 0.014% |
| 1984 | 8.000 | 0.000% | 0.455% | 0.013% |
| 1985 | 8.600 | 7.500% | 0.471% | 0.014% |
| 1986 | 5.700 | -33.721% | 0.313% | 0.009% |
| 1987 | 8.300 | 45.614% | 0.451% | 0.013% |
| 1988 | 9.100 | 9.639% | 0.477% | 0.014% |
| 1989 | 6.500 | -28.571% | 0.328% | 0.010% |
| 1990 | 6.300 | -3.077% | 0.305% | 0.009% |
| 1991 | 6.500 | 3.175% | 0.307% | 0.010% |
| 1992 | 7.000 | 7.692% | 0.325% | 0.010% |
| 1993 | 7.300 | 4.286% | 0.335% | 0.011% |
| 1994 | 8.100 | 10.959% | 0.371% | 0.012% |
| 1995 | 8.400 | 3.704% | 0.373% | 0.012% |
| 1996 | 8.400 | 0.000% | 0.364% | 0.012% |
| 1997 | 8.500 | 1.190% | 0.358% | 0.012% |
| 1998 | 8.600 | 1.176% | 0.358% | 0.012% |
| 1999 | 8.600 | 0.000% | 0.351% | 0.011% |
| 2000 | 12.000 | 39.535% | 0.469% | 0.016% |
| 2001 | 13.000 | 8.333% | 0.496% | 0.017% |
| 2002 | 15.000 | 15.385% | 0.554% | 0.019% |
| 2003 | 16.000 | 6.667% | 0.581% | 0.020% |
| 2004 | 17.000 | 6.250% | 0.596% | 0.020% |
| 2005 | 17.000 | 0.000% | 0.572% | 0.020% |
| 2006 | 17.000 | 0.000% | 0.565% | 0.020% |
| 2007 | 16.000 | -5.882% | 0.524% | 0.018% |
| 2008 | 14.000 | -12.500% | 0.439% | 0.016% |
| 2009 | 12.000 | -14.286% | 0.359% | 0.014% |
| 2010 | 12.000 | 0.000% | 0.341% | 0.013% |
| 2011 | 12.000 | 0.000% | 0.348% | 0.013% |
| 2012 | 12.000 | 0.000% | 0.329% | 0.013% |
| 2013 | 15.000 | 25.000% | 0.394% | 0.016% |
| 2014 | 15.000 | 0.000% | 0.376% | 0.016% |
| 2015 | 15.000 | 0.000% | 0.375% | 0.016% |
Historical Energy Data about Madagascar
Total Oil Supply
Total Consumption of Petroleum Products
Oil and Petroleum Products, Net Exports/Imports (-)
Dry Natural Gas, Net Exports/Imports (-)
Proved Reserves of Natural Gas
Total Coal Consumption
Coal, Net Exports/Imports (-)
Total Electricity Net Generation
Total Electricity Net Consumption
Electricity, Net Exports/Imports (-)
Total Conventional Thermal Electricity Net Generation
Hydroelectricity Net Generation
Total Primary Energy Production
Total Primary Energy Consumption
Total Carbon Dioxide Emissions from the Consumption of Energy
Population