| Business / Energy Data |
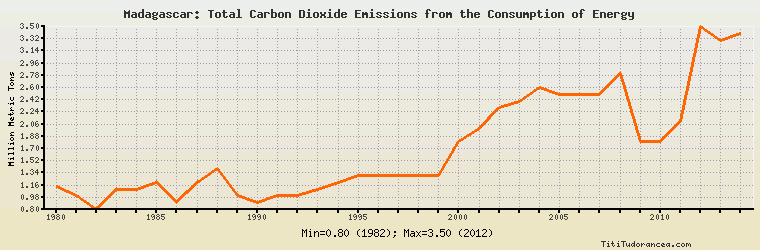
Madagascar: Total Carbon Dioxide Emissions from the Consumption of Energy
Million Metric Tons
| Year | Madagascar | Change, percent | Madagascar, percent of Africa | Madagascar, percent of World |
| 1980 | 1.144 | N/A | 0.218% | 0.006% |
| 1981 | 1.000 | -12.587% | 0.192% | 0.006% |
| 1982 | 0.800 | -20.000% | 0.143% | 0.004% |
| 1983 | 1.100 | 37.500% | 0.188% | 0.006% |
| 1984 | 1.100 | 0.000% | 0.179% | 0.006% |
| 1985 | 1.200 | 9.091% | 0.190% | 0.006% |
| 1986 | 0.900 | -25.000% | 0.138% | 0.005% |
| 1987 | 1.200 | 33.333% | 0.179% | 0.006% |
| 1988 | 1.400 | 16.667% | 0.205% | 0.007% |
| 1989 | 1.000 | -28.571% | 0.141% | 0.005% |
| 1990 | 0.900 | -10.000% | 0.122% | 0.004% |
| 1991 | 1.000 | 11.111% | 0.134% | 0.005% |
| 1992 | 1.000 | 0.000% | 0.134% | 0.005% |
| 1993 | 1.100 | 10.000% | 0.142% | 0.005% |
| 1994 | 1.200 | 9.091% | 0.152% | 0.006% |
| 1995 | 1.300 | 8.333% | 0.159% | 0.006% |
| 1996 | 1.300 | 0.000% | 0.154% | 0.006% |
| 1997 | 1.300 | 0.000% | 0.153% | 0.006% |
| 1998 | 1.300 | 0.000% | 0.150% | 0.006% |
| 1999 | 1.300 | 0.000% | 0.151% | 0.006% |
| 2000 | 1.800 | 38.462% | 0.205% | 0.008% |
| 2001 | 2.000 | 11.111% | 0.224% | 0.008% |
| 2002 | 2.300 | 15.000% | 0.249% | 0.009% |
| 2003 | 2.400 | 4.348% | 0.248% | 0.009% |
| 2004 | 2.600 | 8.333% | 0.259% | 0.010% |
| 2005 | 2.500 | -3.846% | 0.242% | 0.009% |
| 2006 | 2.500 | 0.000% | 0.238% | 0.009% |
| 2007 | 2.500 | 0.000% | 0.232% | 0.009% |
| 2008 | 2.800 | 12.000% | 0.249% | 0.009% |
| 2009 | 1.800 | -35.714% | 0.164% | 0.006% |
| 2010 | 1.800 | 0.000% | 0.156% | 0.006% |
| 2011 | 2.100 | 16.667% | 0.184% | 0.006% |
| 2012 | 3.500 | 66.667% | 0.292% | 0.011% |
| 2013 | 3.300 | -5.714% | 0.267% | 0.010% |
| 2014 | 3.400 | 3.030% | 0.268% | 0.010% |
Historical Energy Data about Madagascar
Total Oil Supply
Total Consumption of Petroleum Products
Oil and Petroleum Products, Net Exports/Imports (-)
Dry Natural Gas, Net Exports/Imports (-)
Proved Reserves of Natural Gas
Total Coal Consumption
Coal, Net Exports/Imports (-)
Total Electricity Net Generation
Total Electricity Net Consumption
Electricity, Net Exports/Imports (-)
Total Conventional Thermal Electricity Net Generation
Hydroelectricity Net Generation
Total Primary Energy Production
Total Primary Energy Consumption
Total Carbon Dioxide Emissions from the Consumption of Energy
Population