| Business / Energy Data |
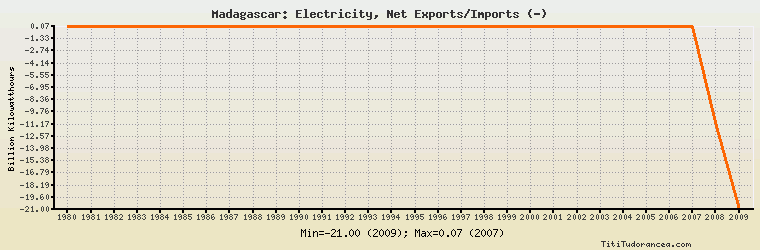
Madagascar: Electricity, Net Exports/Imports (-)
Billion Kilowatthours
| Year | Madagascar | Change, percent | Madagascar, percent of Africa | Madagascar, percent of World |
| 1980 | 0.029 | N/A | - | N/A |
| 1981 | 0.029 | 0.000% | - | N/A |
| 1982 | 0.030 | 3.448% | -333.333% | N/A |
| 1983 | 0.032 | 6.667% | -11.511% | N/A |
| 1984 | 0.033 | 3.125% | -64.706% | N/A |
| 1985 | 0.034 | 3.030% | - | N/A |
| 1986 | 0.034 | 0.000% | -29.565% | N/A |
| 1987 | 0.033 | -2.941% | -16.500% | N/A |
| 1988 | 0.034 | 3.030% | -12.687% | N/A |
| 1989 | 0.038 | 11.765% | -38.776% | N/A |
| 1990 | 0.040 | 5.263% | -8.197% | N/A |
| 1991 | 0.040 | 0.000% | -17.094% | N/A |
| 1992 | 0.041 | 2.500% | 27.703% | N/A |
| 1993 | 0.041 | 0.000% | -80.392% | N/A |
| 1994 | 0.041 | 0.000% | -32.540% | N/A |
| 1995 | 0.043 | 4.878% | 9.451% | N/A |
| 1996 | 0.046 | 6.977% | 2.594% | N/A |
| 1997 | 0.049 | 6.522% | 3.107% | N/A |
| 1998 | 0.052 | 6.122% | -1.475% | N/A |
| 1999 | 0.054 | 3.846% | -2.192% | N/A |
| 2000 | 0.055 | 1.852% | -1.464% | N/A |
| 2001 | 0.055 | 0.000% | -1.999% | N/A |
| 2002 | 0.055 | 0.000% | -3.029% | N/A |
| 2003 | 0.061 | 10.909% | -1.946% | N/A |
| 2004 | 0.067 | 9.836% | -4.083% | N/A |
| 2005 | 0.070 | 4.478% | -3.165% | N/A |
| 2006 | 0.068 | -2.857% | -1.674% | N/A |
| 2007 | 0.074 | 8.824% | -1.615% | N/A |
| 2008 | -11.000 | -14,964.865% | 260.478% | N/A |
| 2009 | -21.000 | 90.909% | 487.239% | N/A |
Historical Energy Data about Madagascar
Total Oil Supply
Total Consumption of Petroleum Products
Oil and Petroleum Products, Net Exports/Imports (-)
Dry Natural Gas, Net Exports/Imports (-)
Proved Reserves of Natural Gas
Total Coal Consumption
Coal, Net Exports/Imports (-)
Total Electricity Net Generation
Total Electricity Net Consumption
Electricity, Net Exports/Imports (-)
Total Conventional Thermal Electricity Net Generation
Hydroelectricity Net Generation
Total Primary Energy Production
Total Primary Energy Consumption
Total Carbon Dioxide Emissions from the Consumption of Energy
Population