| Business / Energy Data |
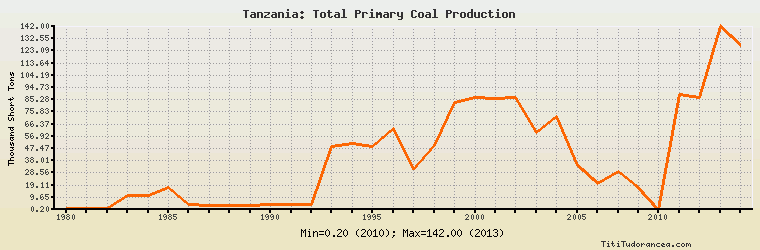
Tanzania: Total Primary Coal Production
Thousand Short Tons
| Year | Tanzania | Change, percent | Tanzania, percent of Africa | Tanzania, percent of World |
| 1980 | 1.102 | N/A | 0.001% | 0.000% |
| 1981 | 1.100 | -0.181% | 0.001% | 0.000% |
| 1982 | 1.100 | 0.000% | 0.001% | 0.000% |
| 1983 | 11.000 | 900.000% | 0.007% | 0.000% |
| 1984 | 11.000 | 0.000% | 0.006% | 0.000% |
| 1985 | 17.000 | 54.545% | 0.009% | 0.000% |
| 1986 | 4.400 | -74.118% | 0.002% | 0.000% |
| 1987 | 3.300 | -25.000% | 0.002% | 0.000% |
| 1988 | 3.300 | 0.000% | 0.002% | 0.000% |
| 1989 | 3.300 | 0.000% | 0.002% | 0.000% |
| 1990 | 4.400 | 33.333% | 0.002% | 0.000% |
| 1991 | 4.400 | 0.000% | 0.002% | 0.000% |
| 1992 | 4.400 | 0.000% | 0.002% | 0.000% |
| 1993 | 49.000 | 1,013.636% | 0.023% | 0.001% |
| 1994 | 51.000 | 4.082% | 0.023% | 0.001% |
| 1995 | 49.000 | -3.922% | 0.021% | 0.001% |
| 1996 | 63.000 | 28.571% | 0.027% | 0.001% |
| 1997 | 31.000 | -50.794% | 0.012% | 0.001% |
| 1998 | 50.000 | 61.290% | 0.020% | 0.001% |
| 1999 | 83.000 | 66.000% | 0.033% | 0.002% |
| 2000 | 87.000 | 4.819% | 0.034% | 0.002% |
| 2001 | 86.000 | -1.149% | 0.034% | 0.002% |
| 2002 | 87.000 | 1.163% | 0.035% | 0.002% |
| 2003 | 60.000 | -31.034% | 0.022% | 0.001% |
| 2004 | 72.000 | 20.000% | 0.026% | 0.001% |
| 2005 | 34.000 | -52.778% | 0.012% | 0.001% |
| 2006 | 20.000 | -41.176% | 0.007% | 0.000% |
| 2007 | 30.000 | 50.000% | 0.011% | 0.000% |
| 2008 | 17.000 | -43.333% | 0.006% | 0.000% |
| 2009 | N/A | N/A | N/A | N/A |
| 2010 | 0.200 | N/A | 0.000% | N/A |
| 2011 | 89.000 | 44,400.000% | 0.031% | N/A |
| 2012 | 87.000 | -2.247% | 0.029% | N/A |
| 2013 | 142.000 | 63.218% | 0.048% | N/A |
| 2014 | 127.000 | -10.563% | 0.041% | N/A |
Historical Energy Data about Tanzania
Total Oil Supply
Total Consumption of Petroleum Products
Oil and Petroleum Products, Net Exports/Imports (-)
Dry Natural Gas Production
Dry Natural Gas Consumption
Dry Natural Gas, Net Exports/Imports (-)
Proved Reserves of Natural Gas
Total Primary Coal Production
Total Coal Consumption
Coal, Net Exports/Imports (-)
Total Recoverable Coal
Total Electricity Net Generation
Total Electricity Net Consumption
Total Electricity Imports
Electricity, Net Exports/Imports (-)
Total Conventional Thermal Electricity Net Generation
Hydroelectricity Net Generation
Total Primary Energy Production
Total Primary Energy Consumption
Total Carbon Dioxide Emissions from the Consumption of Energy
Population