| Business / Energy Data |
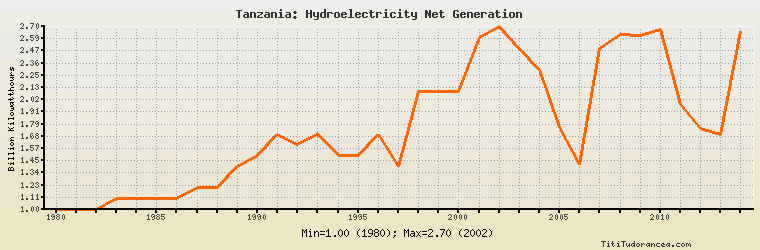
Tanzania: Hydroelectricity Net Generation
Billion Kilowatthours
| Year | Tanzania | Change, percent | Tanzania, percent of Africa | Tanzania, percent of World |
| 1980 | 1.000 | N/A | 1.692% | 0.058% |
| 1981 | 1.000 | 0.000% | 1.902% | 0.057% |
| 1982 | 1.000 | 0.000% | 1.931% | 0.056% |
| 1983 | 1.100 | 10.000% | 2.205% | 0.059% |
| 1984 | 1.100 | 0.000% | 2.450% | 0.057% |
| 1985 | 1.100 | 0.000% | 2.362% | 0.056% |
| 1986 | 1.100 | 0.000% | 2.232% | 0.055% |
| 1987 | 1.200 | 9.091% | 2.479% | 0.060% |
| 1988 | 1.200 | 0.000% | 2.348% | 0.058% |
| 1989 | 1.400 | 16.667% | 2.677% | 0.068% |
| 1990 | 1.500 | 7.143% | 2.732% | 0.070% |
| 1991 | 1.700 | 13.333% | 2.996% | 0.078% |
| 1992 | 1.600 | -5.882% | 2.865% | 0.073% |
| 1993 | 1.700 | 6.250% | 3.096% | 0.073% |
| 1994 | 1.500 | -11.765% | 2.686% | 0.064% |
| 1995 | 1.500 | 0.000% | 2.537% | 0.061% |
| 1996 | 1.700 | 13.333% | 2.741% | 0.068% |
| 1997 | 1.400 | -17.647% | 2.196% | 0.055% |
| 1998 | 2.100 | 50.000% | 3.441% | 0.082% |
| 1999 | 2.100 | 0.000% | 2.913% | 0.081% |
| 2000 | 2.100 | 0.000% | 2.818% | 0.080% |
| 2001 | 2.600 | 23.810% | 3.204% | 0.101% |
| 2002 | 2.700 | 3.846% | 3.239% | 0.104% |
| 2003 | 2.500 | -7.407% | 3.044% | 0.096% |
| 2004 | 2.300 | -8.000% | 2.666% | 0.083% |
| 2005 | 1.760 | -23.478% | 1.994% | 0.061% |
| 2006 | 1.422 | -19.205% | 1.558% | 0.047% |
| 2007 | 2.499 | 75.738% | 2.670% | 0.082% |
| 2008 | 2.623 | 4.962% | 2.754% | 0.083% |
| 2009 | 2.614 | -0.343% | 2.660% | 0.081% |
| 2010 | 2.674 | 2.295% | 2.452% | 0.079% |
| 2011 | 1.973 | -26.215% | 1.785% | 0.057% |
| 2012 | 1.749 | -11.353% | 1.559% | 0.048% |
| 2013 | 1.700 | -2.802% | 1.476% | 0.045% |
| 2014 | 2.654 | 56.118% | 2.168% | 0.069% |
Historical Energy Data about Tanzania
Total Oil Supply
Total Consumption of Petroleum Products
Oil and Petroleum Products, Net Exports/Imports (-)
Dry Natural Gas Production
Dry Natural Gas Consumption
Dry Natural Gas, Net Exports/Imports (-)
Proved Reserves of Natural Gas
Total Primary Coal Production
Total Coal Consumption
Coal, Net Exports/Imports (-)
Total Recoverable Coal
Total Electricity Net Generation
Total Electricity Net Consumption
Total Electricity Imports
Electricity, Net Exports/Imports (-)
Total Conventional Thermal Electricity Net Generation
Hydroelectricity Net Generation
Total Primary Energy Production
Total Primary Energy Consumption
Total Carbon Dioxide Emissions from the Consumption of Energy
Population