| Business / Energy Data |
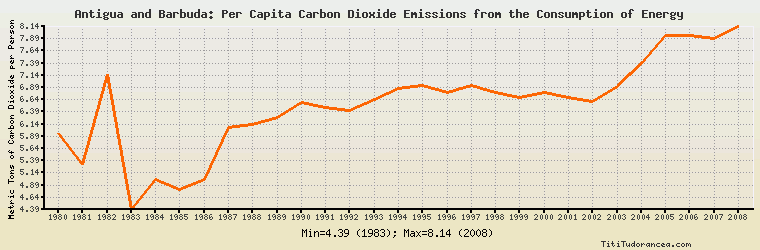
Antigua and Barbuda: Per Capita Carbon Dioxide Emissions from the Consumption of Energy
Metric Tons of Carbon Dioxide per Person
| Year | Antigua and Barbuda | Change, percent | Antigua and Barbuda, percent of Central & South America | Antigua and Barbuda, percent of World |
| 1980 | 5.943 | N/A | N/A | 143.101% |
| 1981 | 5.319 | -10.500% | N/A | 131.887% |
| 1982 | 7.150 | 34.424% | N/A | 181.518% |
| 1983 | 4.388 | -38.629% | N/A | 112.542% |
| 1984 | 5.008 | 14.129% | N/A | 124.608% |
| 1985 | 4.794 | -4.273% | N/A | 118.605% |
| 1986 | 5.011 | 4.526% | N/A | 123.302% |
| 1987 | 6.077 | 21.273% | N/A | 148.292% |
| 1988 | 6.139 | 1.020% | N/A | 147.501% |
| 1989 | 6.276 | 2.232% | N/A | 151.192% |
| 1990 | 6.588 | 4.971% | N/A | 160.526% |
| 1991 | 6.479 | -1.655% | N/A | 161.169% |
| 1992 | 6.426 | -0.818% | N/A | 163.055% |
| 1993 | 6.652 | 3.517% | N/A | 169.435% |
| 1994 | 6.868 | 3.247% | N/A | 176.238% |
| 1995 | 6.926 | 0.844% | N/A | 177.453% |
| 1996 | 6.791 | -1.949% | N/A | 172.536% |
| 1997 | 6.927 | 2.003% | N/A | 175.190% |
| 1998 | 6.799 | -1.848% | N/A | 174.737% |
| 1999 | 6.686 | -1.662% | N/A | 171.744% |
| 2000 | 6.781 | 1.421% | N/A | 172.808% |
| 2001 | 6.679 | -1.504% | N/A | 171.213% |
| 2002 | 6.597 | -1.228% | N/A | 166.213% |
| 2003 | 6.907 | 4.699% | N/A | 167.849% |
| 2004 | 7.391 | 7.007% | N/A | 170.890% |
| 2005 | 7.959 | 7.685% | N/A | 180.640% |
| 2006 | 7.953 | -0.075% | N/A | 179.041% |
| 2007 | 7.900 | -0.666% | N/A | 174.895% |
| 2008 | 8.144 | 3.089% | N/A | 179.383% |
| 2009 | N/A | N/A | N/A | N/A |
| 2010 | N/A | N/A | N/A | N/A |
Historical Energy Data about Antigua and Barbuda
Total Consumption of Petroleum Products
Oil and Petroleum Products, Net Exports/Imports (-)
Dry Natural Gas, Net Exports/Imports (-)
Coal, Net Exports/Imports (-)
Total Electricity Net Generation
Total Electricity Net Consumption
Electricity, Net Exports/Imports (-)
Total Conventional Thermal Electricity Net Generation
Total Primary Energy Consumption
Total Carbon Dioxide Emissions from the Consumption of Energy
Population