| Business / Energy Data |
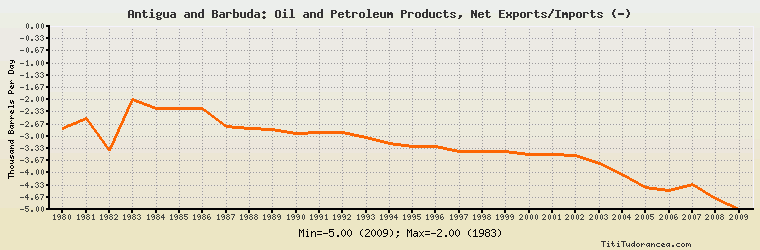
Antigua and Barbuda: Oil and Petroleum Products, Net Exports/Imports (-)
Thousand Barrels Per Day
| Year | Antigua and Barbuda | Change, percent | Antigua and Barbuda, percent of Central & South America | Antigua and Barbuda, percent of World |
| 1980 | -2.800 | N/A | -0.508% | N/A |
| 1981 | -2.500 | -10.714% | -0.828% | N/A |
| 1982 | -3.400 | 36.000% | -1.288% | N/A |
| 1983 | -2.000 | -41.176% | -0.453% | N/A |
| 1984 | -2.234 | 11.700% | -0.358% | N/A |
| 1985 | -2.230 | -0.179% | -0.324% | N/A |
| 1986 | -2.233 | 0.135% | -0.327% | N/A |
| 1987 | -2.722 | 21.899% | -0.534% | N/A |
| 1988 | -2.798 | 2.792% | -0.397% | N/A |
| 1989 | -2.805 | 0.250% | -0.379% | N/A |
| 1990 | -2.933 | 4.563% | -0.315% | N/A |
| 1991 | -2.893 | -1.364% | -0.260% | N/A |
| 1992 | -2.885 | -0.277% | -0.262% | N/A |
| 1993 | -3.040 | 5.373% | -0.250% | N/A |
| 1994 | -3.188 | 4.868% | -0.227% | N/A |
| 1995 | -3.274 | 2.698% | -0.199% | N/A |
| 1996 | -3.266 | -0.244% | -0.177% | N/A |
| 1997 | -3.402 | 4.164% | -0.161% | N/A |
| 1998 | -3.402 | 0.000% | -0.166% | N/A |
| 1999 | -3.402 | 0.000% | -0.188% | N/A |
| 2000 | -3.499 | 2.851% | -0.173% | N/A |
| 2001 | -3.510 | 0.314% | -0.185% | N/A |
| 2002 | -3.529 | 0.541% | -0.207% | N/A |
| 2003 | -3.740 | 5.979% | -0.250% | N/A |
| 2004 | -4.038 | 7.968% | -0.255% | N/A |
| 2005 | -4.399 | 8.940% | -0.269% | N/A |
| 2006 | -4.471 | 1.637% | -0.301% | N/A |
| 2007 | -4.309 | -3.623% | -0.321% | N/A |
| 2008 | -4.700 | 9.074% | -0.282% | N/A |
| 2009 | -5.000 | 6.383% | -0.325% | N/A |
Historical Energy Data about Antigua and Barbuda
Total Consumption of Petroleum Products
Oil and Petroleum Products, Net Exports/Imports (-)
Dry Natural Gas, Net Exports/Imports (-)
Coal, Net Exports/Imports (-)
Total Electricity Net Generation
Total Electricity Net Consumption
Electricity, Net Exports/Imports (-)
Total Conventional Thermal Electricity Net Generation
Total Primary Energy Consumption
Total Carbon Dioxide Emissions from the Consumption of Energy
Population