| Business / Energy Data |
Aruba: Total Oil Supply
Thousand Barrels Per Day
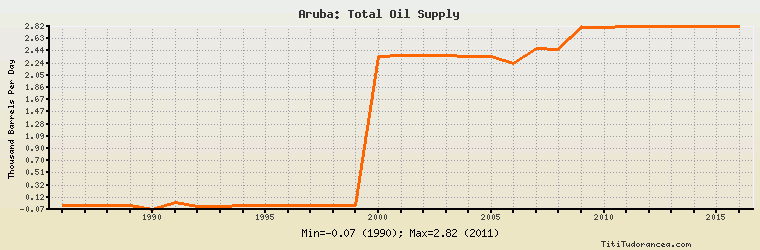
| Year | Aruba | Change, percent | Aruba, percent of Central & South America | Aruba, percent of World |
| 1980 | N/A | N/A | N/A | N/A |
| 1981 | N/A | N/A | N/A | N/A |
| 1982 | N/A | N/A | N/A | N/A |
| 1983 | N/A | N/A | N/A | N/A |
| 1984 | N/A | N/A | N/A | N/A |
| 1985 | N/A | N/A | N/A | N/A |
| 1986 | 0.000 | N/A | 0.00% | 0.00% |
| 1987 | 0.000 | 0.000% | 0.00% | 0.00% |
| 1988 | 0.000 | 0.000% | 0.00% | 0.00% |
| 1989 | 0.000 | 0.000% | 0.00% | 0.00% |
| 1990 | -0.068 | 0.000% | -0.001% | -0.000% |
| 1991 | 0.039 | -157.353% | 0.001% | 0.000% |
| 1992 | -0.028 | -171.795% | -0.001% | -0.000% |
| 1993 | -0.028 | 0.000% | -0.001% | -0.000% |
| 1994 | 0.000 | -100.000% | 0.00% | 0.00% |
| 1995 | 0.000 | 0.000% | 0.00% | 0.00% |
| 1996 | 0.000 | 0.000% | 0.00% | 0.00% |
| 1997 | 0.000 | 0.000% | 0.00% | 0.00% |
| 1998 | 0.000 | 0.000% | 0.00% | 0.00% |
| 1999 | 0.000 | 0.000% | 0.00% | 0.00% |
| 2000 | 2.356 | 0.000% | 0.032% | 0.003% |
| 2001 | 2.363 | 0.297% | 0.033% | 0.003% |
| 2002 | 2.363 | 0.000% | 0.034% | 0.003% |
| 2003 | 2.363 | 0.000% | 0.035% | 0.003% |
| 2004 | 2.356 | -0.296% | 0.034% | 0.003% |
| 2005 | 2.351 | -0.212% | 0.032% | 0.003% |
| 2006 | 2.235 | -4.934% | 0.031% | 0.003% |
| 2007 | 2.477 | 10.828% | 0.034% | 0.003% |
| 2008 | 2.465 | -0.484% | 0.033% | 0.003% |
| 2009 | 2.811 | 14.037% | 0.036% | 0.003% |
| 2010 | 2.813 | 0.071% | 0.036% | 0.003% |
| 2011 | 2.822 | 0.320% | 0.035% | 0.003% |
| 2012 | 2.822 | 0.000% | 0.035% | 0.003% |
| 2013 | 2.822 | 0.000% | 0.035% | 0.003% |
| 2014 | 2.822 | 0.000% | 0.034% | 0.003% |
| 2015 | 2.822 | 0.000% | 0.033% | 0.003% |
| 2016 | 2.822 | 0.000% | 0.034% | 0.003% |
Historical Energy Data about Aruba
Total Oil Supply
Total Consumption of Petroleum Products
Oil and Petroleum Products, Net Exports/Imports (-)
Dry Natural Gas, Net Exports/Imports (-)
Coal, Net Exports/Imports (-)
Total Electricity Net Generation
Total Electricity Net Consumption
Electricity, Net Exports/Imports (-)
Total Conventional Thermal Electricity Net Generation
Total Primary Energy Consumption
Total Carbon Dioxide Emissions from the Consumption of Energy
Population