| Business / Energy Data |
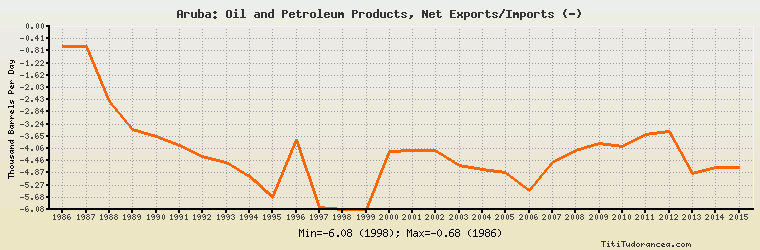
Aruba: Oil and Petroleum Products, Net Exports/Imports (-)
Thousand Barrels Per Day
| Year | Aruba | Change, percent | Aruba, percent of Central & South America | Aruba, percent of World |
| 1986 | -0.680 | N/A | -0.100% | N/A |
| 1987 | -0.680 | 0.000% | -0.134% | N/A |
| 1988 | -2.509 | 268.971% | -0.356% | N/A |
| 1989 | -3.416 | 36.150% | -0.462% | N/A |
| 1990 | -3.668 | 7.377% | -0.393% | N/A |
| 1991 | -3.961 | 7.988% | -0.356% | N/A |
| 1992 | -4.328 | 9.265% | -0.393% | N/A |
| 1993 | -4.528 | 4.621% | -0.373% | N/A |
| 1994 | -4.972 | 9.806% | -0.354% | N/A |
| 1995 | -5.692 | 14.481% | -0.345% | N/A |
| 1996 | -3.767 | -33.819% | -0.204% | N/A |
| 1997 | -6.009 | 59.517% | -0.284% | N/A |
| 1998 | -6.084 | 1.248% | -0.296% | N/A |
| 1999 | -6.084 | 0.000% | -0.337% | N/A |
| 2000 | -4.144 | -31.887% | -0.205% | N/A |
| 2001 | -4.137 | -0.169% | -0.219% | N/A |
| 2002 | -4.137 | 0.000% | -0.243% | N/A |
| 2003 | -4.637 | 12.086% | -0.310% | N/A |
| 2004 | -4.744 | 2.308% | -0.299% | N/A |
| 2005 | -4.849 | 2.213% | -0.297% | N/A |
| 2006 | -5.465 | 12.704% | -0.367% | N/A |
| 2007 | -4.523 | -17.237% | -0.337% | N/A |
| 2008 | -4.135 | -8.578% | -0.248% | N/A |
| 2009 | -3.889 | -5.949% | -0.253% | N/A |
| 2010 | -3.987 | 2.520% | -0.317% | N/A |
| 2011 | -3.578 | -10.258% | -0.275% | N/A |
| 2012 | -3.478 | -2.795% | -0.370% | N/A |
| 2013 | -4.878 | 40.253% | -0.488% | N/A |
| 2014 | -4.678 | -4.100% | -0.418% | N/A |
| 2015 | -4.678 | 0.000% | -0.344% | N/A |
Historical Energy Data about Aruba
Total Oil Supply
Total Consumption of Petroleum Products
Oil and Petroleum Products, Net Exports/Imports (-)
Dry Natural Gas, Net Exports/Imports (-)
Coal, Net Exports/Imports (-)
Total Electricity Net Generation
Total Electricity Net Consumption
Electricity, Net Exports/Imports (-)
Total Conventional Thermal Electricity Net Generation
Total Primary Energy Consumption
Total Carbon Dioxide Emissions from the Consumption of Energy
Population