| Business / Energy Data |
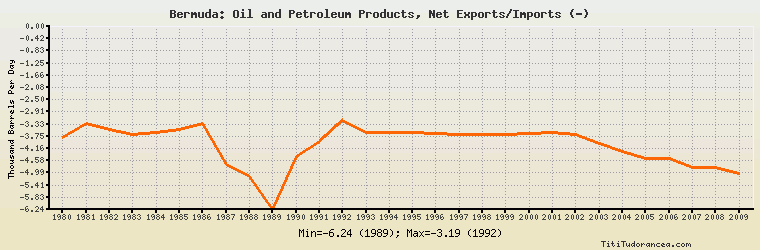
Bermuda: Oil and Petroleum Products, Net Exports/Imports (-)
Thousand Barrels Per Day
| Year | Bermuda | Change, percent | Bermuda, percent of North America | Bermuda, percent of World |
| 1980 | -3.800 | N/A | 0.070% | N/A |
| 1981 | -3.300 | -13.158% | 0.077% | N/A |
| 1982 | -3.500 | 6.061% | 0.119% | N/A |
| 1983 | -3.700 | 5.714% | 0.142% | N/A |
| 1984 | -3.600 | -2.703% | 0.135% | N/A |
| 1985 | -3.524 | -2.111% | 0.133% | N/A |
| 1986 | -3.325 | -5.647% | 0.088% | N/A |
| 1987 | -4.691 | 41.083% | 0.108% | N/A |
| 1988 | -5.125 | 9.252% | 0.100% | N/A |
| 1989 | -6.242 | 21.795% | 0.105% | N/A |
| 1990 | -4.435 | -28.949% | 0.079% | N/A |
| 1991 | -3.928 | -11.432% | 0.078% | N/A |
| 1992 | -3.194 | -18.686% | 0.058% | N/A |
| 1993 | -3.631 | 13.682% | 0.063% | N/A |
| 1994 | -3.620 | -0.303% | 0.056% | N/A |
| 1995 | -3.606 | -0.387% | 0.056% | N/A |
| 1996 | -3.658 | 1.442% | 0.054% | N/A |
| 1997 | -3.668 | 0.273% | 0.053% | N/A |
| 1998 | -3.668 | 0.000% | 0.050% | N/A |
| 1999 | -3.668 | 0.000% | 0.043% | N/A |
| 2000 | -3.658 | -0.273% | 0.043% | N/A |
| 2001 | -3.632 | -0.711% | 0.043% | N/A |
| 2002 | -3.668 | 0.991% | 0.044% | N/A |
| 2003 | -3.982 | 8.561% | 0.047% | N/A |
| 2004 | -4.250 | 6.730% | 0.046% | N/A |
| 2005 | -4.505 | 6.000% | 0.045% | N/A |
| 2006 | -4.500 | -0.111% | 0.046% | N/A |
| 2007 | -4.804 | 6.756% | 0.049% | N/A |
| 2008 | -4.800 | -0.083% | 0.054% | N/A |
| 2009 | -5.000 | 4.167% | 0.066% | N/A |
Historical Energy Data about Bermuda
Total Consumption of Petroleum Products
Oil and Petroleum Products, Net Exports/Imports (-)
Dry Natural Gas, Net Exports/Imports (-)
Coal, Net Exports/Imports (-)
Total Electricity Net Generation
Total Electricity Net Consumption
Electricity, Net Exports/Imports (-)
Total Conventional Thermal Electricity Net Generation
Total Primary Energy Consumption
Total Carbon Dioxide Emissions from the Consumption of Energy
Population