| Business / Energy Data |
U.S. Pacific Islands: Total Consumption of Petroleum Products
Thousand Barrels Per Day
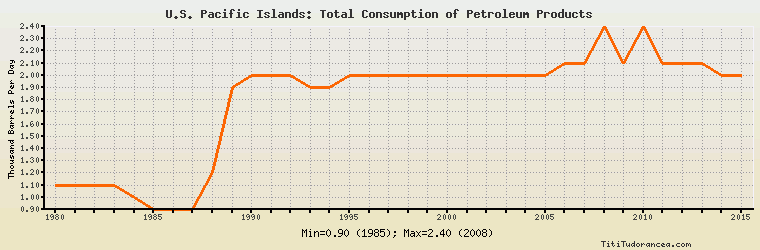
| Year | U.S. Pacific Islands | Change, percent | U.S. Pacific Islands, percent of Asia & Oceania | U.S. Pacific Islands, percent of World |
| 1980 | 1.100 | N/A | 0.010% | 0.002% |
| 1981 | 1.100 | 0.000% | 0.010% | 0.002% |
| 1982 | 1.100 | 0.000% | 0.011% | 0.002% |
| 1983 | 1.100 | 0.000% | 0.011% | 0.002% |
| 1984 | 1.000 | -9.091% | 0.009% | 0.002% |
| 1985 | 0.900 | -10.000% | 0.008% | 0.001% |
| 1986 | 0.900 | 0.000% | 0.008% | 0.001% |
| 1987 | 0.900 | 0.000% | 0.008% | 0.001% |
| 1988 | 1.200 | 33.333% | 0.010% | 0.002% |
| 1989 | 1.900 | 58.333% | 0.014% | 0.003% |
| 1990 | 2.000 | 5.263% | 0.014% | 0.003% |
| 1991 | 2.000 | 0.000% | 0.014% | 0.003% |
| 1992 | 2.000 | 0.000% | 0.013% | 0.003% |
| 1993 | 1.900 | -5.000% | 0.012% | 0.003% |
| 1994 | 1.900 | 0.000% | 0.011% | 0.003% |
| 1995 | 2.000 | 5.263% | 0.011% | 0.003% |
| 1996 | 2.000 | 0.000% | 0.011% | 0.003% |
| 1997 | 2.000 | 0.000% | 0.010% | 0.003% |
| 1998 | 2.000 | 0.000% | 0.010% | 0.003% |
| 1999 | 2.000 | 0.000% | 0.010% | 0.003% |
| 2000 | 2.000 | 0.000% | 0.010% | 0.003% |
| 2001 | 2.000 | 0.000% | 0.010% | 0.003% |
| 2002 | 2.000 | 0.000% | 0.009% | 0.003% |
| 2003 | 2.000 | 0.000% | 0.009% | 0.002% |
| 2004 | 2.000 | 0.000% | 0.008% | 0.002% |
| 2005 | 2.000 | 0.000% | 0.008% | 0.002% |
| 2006 | 2.100 | 5.000% | 0.008% | 0.002% |
| 2007 | 2.100 | 0.000% | 0.008% | 0.002% |
| 2008 | 2.400 | 14.286% | 0.009% | 0.003% |
| 2009 | 2.100 | -12.500% | 0.008% | 0.002% |
| 2010 | 2.400 | 14.286% | 0.009% | 0.003% |
| 2011 | 2.100 | -12.500% | 0.007% | 0.002% |
| 2012 | 2.100 | 0.000% | 0.007% | 0.002% |
| 2013 | 2.100 | 0.000% | 0.007% | 0.002% |
| 2014 | 2.000 | -4.762% | 0.006% | 0.002% |
| 2015 | 2.000 | 0.000% | 0.006% | 0.002% |
Historical Energy Data about U.S. Pacific Islands
Total Consumption of Petroleum Products
Oil and Petroleum Products, Net Exports/Imports (-)
Dry Natural Gas, Net Exports/Imports (-)
Coal, Net Exports/Imports (-)
Total Electricity Net Generation
Total Electricity Net Consumption
Electricity, Net Exports/Imports (-)
Total Conventional Thermal Electricity Net Generation
Hydroelectricity Net Generation
Total Primary Energy Consumption
Total Carbon Dioxide Emissions from the Consumption of Energy
Population