| Business / Energy Data |
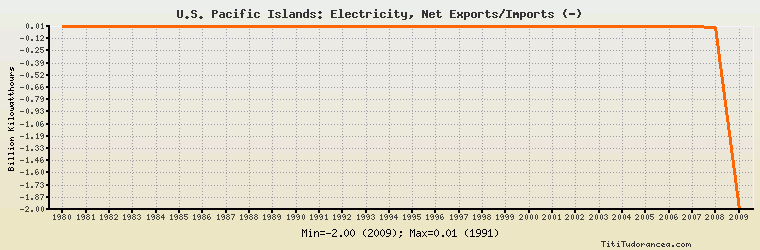
U.S. Pacific Islands: Electricity, Net Exports/Imports (-)
Billion Kilowatthours
| Year | U.S. Pacific Islands | Change, percent | U.S. Pacific Islands, percent of Asia & Oceania | U.S. Pacific Islands, percent of World |
| 1980 | 0.009 | N/A | -2.250% | N/A |
| 1981 | 0.010 | 11.111% | -2.342% | N/A |
| 1982 | 0.010 | 0.000% | -1.205% | N/A |
| 1983 | 0.010 | 0.000% | -1.351% | N/A |
| 1984 | 0.010 | 0.000% | -2.283% | N/A |
| 1985 | 0.011 | 10.000% | -3.385% | N/A |
| 1986 | 0.011 | 0.000% | -13.750% | N/A |
| 1987 | 0.011 | 0.000% | 15.278% | N/A |
| 1988 | 0.012 | 9.091% | 17.143% | N/A |
| 1989 | 0.013 | 8.333% | 3.394% | N/A |
| 1990 | 0.013 | 0.000% | 61.905% | N/A |
| 1991 | 0.014 | 7.692% | - | N/A |
| 1992 | 0.014 | 0.000% | - | N/A |
| 1993 | 0.014 | 0.000% | -56.000% | N/A |
| 1994 | 0.014 | 0.000% | - | N/A |
| 1995 | 0.014 | 0.000% | -10.687% | N/A |
| 1996 | 0.014 | 0.000% | -25.926% | N/A |
| 1997 | 0.014 | 0.000% | 10.853% | N/A |
| 1998 | 0.014 | 0.000% | -9.790% | N/A |
| 1999 | 0.014 | 0.000% | 73.684% | N/A |
| 2000 | 0.011 | -21.429% | 19.298% | N/A |
| 2001 | 0.011 | 0.000% | -23.404% | N/A |
| 2002 | 0.011 | 0.000% | 3.846% | N/A |
| 2003 | 0.010 | -9.091% | -0.388% | N/A |
| 2004 | 0.010 | 0.000% | -0.234% | N/A |
| 2005 | 0.010 | 0.000% | -1.385% | N/A |
| 2006 | 0.011 | 10.000% | -0.689% | N/A |
| 2007 | 0.011 | 0.000% | -0.723% | N/A |
| 2008 | 0.000 | -100.000% | 0.00% | N/A |
| 2009 | -2.000 | 0.000% | 42.974% | N/A |
Historical Energy Data about U.S. Pacific Islands
Total Consumption of Petroleum Products
Oil and Petroleum Products, Net Exports/Imports (-)
Dry Natural Gas, Net Exports/Imports (-)
Coal, Net Exports/Imports (-)
Total Electricity Net Generation
Total Electricity Net Consumption
Electricity, Net Exports/Imports (-)
Total Conventional Thermal Electricity Net Generation
Hydroelectricity Net Generation
Total Primary Energy Consumption
Total Carbon Dioxide Emissions from the Consumption of Energy
Population