| Business / Energy Data |
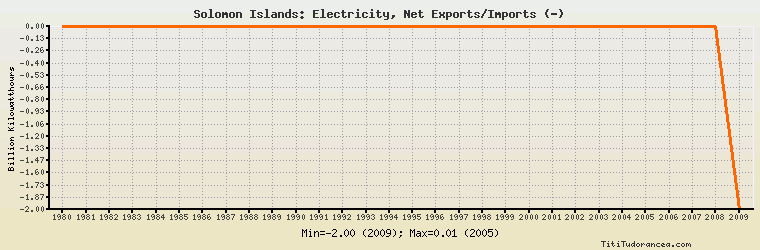
Solomon Islands: Electricity, Net Exports/Imports (-)
Billion Kilowatthours
| Year | Solomon Islands | Change, percent | Solomon Islands, percent of Asia & Oceania | Solomon Islands, percent of World |
| 1980 | 0.001 | N/A | -0.250% | N/A |
| 1981 | 0.002 | 100.000% | -0.468% | N/A |
| 1982 | 0.002 | 0.000% | -0.241% | N/A |
| 1983 | 0.002 | 0.000% | -0.270% | N/A |
| 1984 | 0.002 | 0.000% | -0.457% | N/A |
| 1985 | 0.002 | 0.000% | -0.615% | N/A |
| 1986 | 0.002 | 0.000% | -2.500% | N/A |
| 1987 | 0.002 | 0.000% | 2.778% | N/A |
| 1988 | 0.002 | 0.000% | 2.857% | N/A |
| 1989 | 0.002 | 0.000% | 0.522% | N/A |
| 1990 | 0.002 | 0.000% | 9.524% | N/A |
| 1991 | 0.002 | 0.000% | - | N/A |
| 1992 | 0.002 | 0.000% | - | N/A |
| 1993 | 0.002 | 0.000% | -8.000% | N/A |
| 1994 | 0.002 | 0.000% | - | N/A |
| 1995 | 0.002 | 0.000% | -1.527% | N/A |
| 1996 | 0.003 | 50.000% | -5.556% | N/A |
| 1997 | 0.003 | 0.000% | 2.326% | N/A |
| 1998 | 0.003 | 0.000% | -2.098% | N/A |
| 1999 | 0.004 | 33.333% | 21.053% | N/A |
| 2000 | 0.004 | 0.000% | 7.018% | N/A |
| 2001 | 0.004 | 0.000% | -8.511% | N/A |
| 2002 | 0.004 | 0.000% | 1.399% | N/A |
| 2003 | 0.004 | 0.000% | -0.155% | N/A |
| 2004 | 0.004 | 0.000% | -0.094% | N/A |
| 2005 | 0.005 | 25.000% | -0.693% | N/A |
| 2006 | 0.005 | 0.000% | -0.313% | N/A |
| 2007 | 0.005 | 0.000% | -0.329% | N/A |
| 2008 | 0.000 | -100.000% | 0.00% | N/A |
| 2009 | -2.000 | 0.000% | 42.974% | N/A |
Historical Energy Data about Solomon Islands
Total Consumption of Petroleum Products
Oil and Petroleum Products, Net Exports/Imports (-)
Dry Natural Gas, Net Exports/Imports (-)
Coal, Net Exports/Imports (-)
Total Electricity Net Generation
Total Electricity Net Consumption
Electricity, Net Exports/Imports (-)
Total Conventional Thermal Electricity Net Generation
Total Primary Energy Consumption
Total Carbon Dioxide Emissions from the Consumption of Energy
Population