| Business / Energy Data |
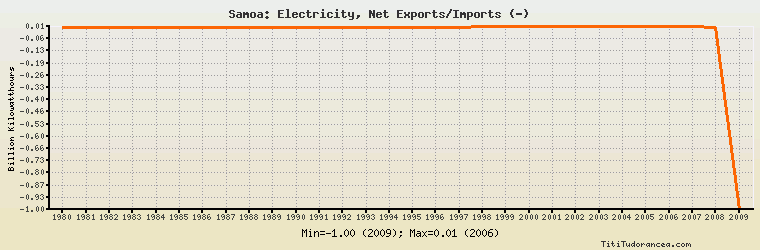
Samoa: Electricity, Net Exports/Imports (-)
Billion Kilowatthours
| Year | Samoa | Change, percent | Samoa, percent of Asia & Oceania | Samoa, percent of World |
| 1980 | 0.003 | N/A | -0.750% | N/A |
| 1981 | 0.003 | 0.000% | -0.703% | N/A |
| 1982 | 0.003 | 0.000% | -0.361% | N/A |
| 1983 | 0.003 | 0.000% | -0.405% | N/A |
| 1984 | 0.003 | 0.000% | -0.685% | N/A |
| 1985 | 0.003 | 0.000% | -0.923% | N/A |
| 1986 | 0.003 | 0.000% | -3.750% | N/A |
| 1987 | 0.003 | 0.000% | 4.167% | N/A |
| 1988 | 0.003 | 0.000% | 4.286% | N/A |
| 1989 | 0.003 | 0.000% | 0.783% | N/A |
| 1990 | 0.003 | 0.000% | 14.286% | N/A |
| 1991 | 0.003 | 0.000% | - | N/A |
| 1992 | 0.004 | 33.333% | - | N/A |
| 1993 | 0.004 | 0.000% | -16.000% | N/A |
| 1994 | 0.004 | 0.000% | - | N/A |
| 1995 | 0.005 | 25.000% | -3.817% | N/A |
| 1996 | 0.005 | 0.000% | -9.259% | N/A |
| 1997 | 0.005 | 0.000% | 3.876% | N/A |
| 1998 | 0.006 | 20.000% | -4.196% | N/A |
| 1999 | 0.007 | 16.667% | 36.842% | N/A |
| 2000 | 0.006 | -14.286% | 10.526% | N/A |
| 2001 | 0.007 | 16.667% | -14.894% | N/A |
| 2002 | 0.007 | 0.000% | 2.448% | N/A |
| 2003 | 0.007 | 0.000% | -0.271% | N/A |
| 2004 | 0.007 | 0.000% | -0.164% | N/A |
| 2005 | 0.007 | 0.000% | -0.970% | N/A |
| 2006 | 0.008 | 14.286% | -0.501% | N/A |
| 2007 | 0.008 | 0.000% | -0.526% | N/A |
| 2008 | 0.000 | -100.000% | 0.00% | N/A |
| 2009 | -1.000 | 0.000% | 21.487% | N/A |
Historical Energy Data about Samoa
Total Consumption of Petroleum Products
Oil and Petroleum Products, Net Exports/Imports (-)
Dry Natural Gas, Net Exports/Imports (-)
Coal, Net Exports/Imports (-)
Total Electricity Net Generation
Total Electricity Net Consumption
Electricity, Net Exports/Imports (-)
Total Conventional Thermal Electricity Net Generation
Hydroelectricity Net Generation
Total Primary Energy Consumption
Total Carbon Dioxide Emissions from the Consumption of Energy
Population