| Business / Energy Data |
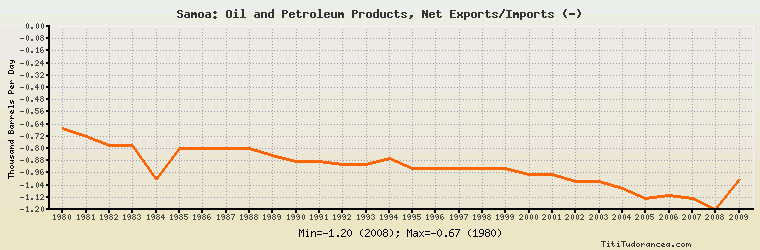
Samoa: Oil and Petroleum Products, Net Exports/Imports (-)
Thousand Barrels Per Day
| Year | Samoa | Change, percent | Samoa, percent of Asia & Oceania | Samoa, percent of World |
| 1980 | -0.670 | N/A | 0.012% | N/A |
| 1981 | -0.720 | 7.463% | 0.013% | N/A |
| 1982 | -0.780 | 8.333% | 0.014% | N/A |
| 1983 | -0.780 | 0.000% | 0.015% | N/A |
| 1984 | -1.000 | 28.205% | 0.020% | N/A |
| 1985 | -0.802 | -19.800% | 0.017% | N/A |
| 1986 | -0.802 | 0.000% | 0.016% | N/A |
| 1987 | -0.802 | 0.000% | 0.015% | N/A |
| 1988 | -0.800 | -0.249% | 0.013% | N/A |
| 1989 | -0.846 | 5.750% | 0.013% | N/A |
| 1990 | -0.887 | 4.846% | 0.013% | N/A |
| 1991 | -0.887 | 0.000% | 0.012% | N/A |
| 1992 | -0.905 | 2.029% | 0.011% | N/A |
| 1993 | -0.908 | 0.331% | 0.010% | N/A |
| 1994 | -0.867 | -4.515% | 0.009% | N/A |
| 1995 | -0.931 | 7.382% | 0.009% | N/A |
| 1996 | -0.928 | -0.322% | 0.008% | N/A |
| 1997 | -0.931 | 0.323% | 0.008% | N/A |
| 1998 | -0.931 | 0.000% | 0.008% | N/A |
| 1999 | -0.931 | 0.000% | 0.008% | N/A |
| 2000 | -0.970 | 4.189% | 0.008% | N/A |
| 2001 | -0.973 | 0.309% | 0.008% | N/A |
| 2002 | -1.016 | 4.419% | 0.008% | N/A |
| 2003 | -1.016 | 0.000% | 0.007% | N/A |
| 2004 | -1.060 | 4.331% | 0.007% | N/A |
| 2005 | -1.128 | 6.415% | 0.007% | N/A |
| 2006 | -1.105 | -2.039% | 0.007% | N/A |
| 2007 | -1.125 | 1.810% | 0.007% | N/A |
| 2008 | -1.200 | 6.667% | 0.007% | N/A |
| 2009 | -1.000 | -16.667% | 0.006% | N/A |
Historical Energy Data about Samoa
Total Consumption of Petroleum Products
Oil and Petroleum Products, Net Exports/Imports (-)
Dry Natural Gas, Net Exports/Imports (-)
Coal, Net Exports/Imports (-)
Total Electricity Net Generation
Total Electricity Net Consumption
Electricity, Net Exports/Imports (-)
Total Conventional Thermal Electricity Net Generation
Hydroelectricity Net Generation
Total Primary Energy Consumption
Total Carbon Dioxide Emissions from the Consumption of Energy
Population