| Business / Energy Data |
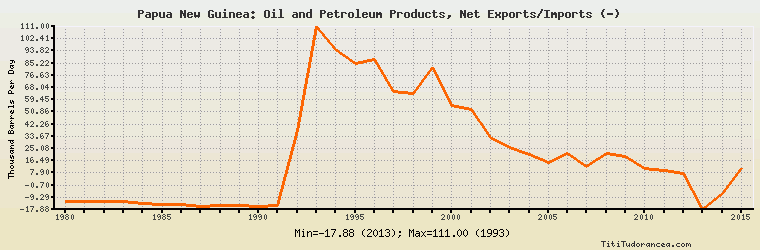
Papua New Guinea: Oil and Petroleum Products, Net Exports/Imports (-)
Thousand Barrels Per Day
| Year | Papua New Guinea | Change, percent | Papua New Guinea, percent of Asia & Oceania | Papua New Guinea, percent of World |
| 1980 | -12.000 | N/A | 0.214% | N/A |
| 1981 | -12.000 | 0.000% | 0.215% | N/A |
| 1982 | -12.000 | 0.000% | 0.219% | N/A |
| 1983 | -12.000 | 0.000% | 0.235% | N/A |
| 1984 | -13.600 | 13.333% | 0.266% | N/A |
| 1985 | -14.353 | 5.537% | 0.303% | N/A |
| 1986 | -14.488 | 0.941% | 0.295% | N/A |
| 1987 | -16.074 | 10.947% | 0.303% | N/A |
| 1988 | -15.006 | -6.644% | 0.248% | N/A |
| 1989 | -15.380 | 2.492% | 0.232% | N/A |
| 1990 | -15.603 | 1.450% | 0.221% | N/A |
| 1991 | -14.800 | -5.146% | 0.198% | N/A |
| 1992 | 38.000 | -356.757% | -0.459% | N/A |
| 1993 | 111.000 | 192.105% | -1.237% | N/A |
| 1994 | 95.000 | -14.414% | -0.966% | N/A |
| 1995 | 85.000 | -10.526% | -0.818% | N/A |
| 1996 | 88.000 | 3.529% | -0.799% | N/A |
| 1997 | 65.000 | -26.136% | -0.562% | N/A |
| 1998 | 64.000 | -1.538% | -0.571% | N/A |
| 1999 | 82.000 | 28.125% | -0.673% | N/A |
| 2000 | 55.085 | -32.823% | -0.440% | N/A |
| 2001 | 52.523 | -4.651% | -0.414% | N/A |
| 2002 | 33.153 | -36.879% | -0.251% | N/A |
| 2003 | 25.493 | -23.105% | -0.179% | N/A |
| 2004 | 20.601 | -19.190% | -0.133% | N/A |
| 2005 | 15.304 | -25.712% | -0.097% | N/A |
| 2006 | 21.751 | 42.126% | -0.133% | N/A |
| 2007 | 12.681 | -41.699% | -0.075% | N/A |
| 2008 | 21.462 | 69.245% | -0.130% | N/A |
| 2009 | 19.706 | -8.182% | -0.114% | N/A |
| 2010 | 10.953 | -44.418% | -0.059% | N/A |
| 2011 | 9.320 | -14.909% | -0.048% | N/A |
| 2012 | 7.489 | -19.646% | -0.036% | N/A |
| 2013 | -17.880 | -338.750% | 0.084% | N/A |
| 2014 | -6.491 | -63.697% | 0.030% | N/A |
| 2015 | 10.761 | -265.783% | -0.048% | N/A |
Historical Energy Data about Papua New Guinea
Total Oil Supply
Total Consumption of Petroleum Products
Oil and Petroleum Products, Net Exports/Imports (-)
Production of Crude Oil including Lease Condensate
Crude Oil Proved Reserves
Dry Natural Gas Production
Dry Natural Gas Consumption
Dry Natural Gas, Net Exports/Imports (-)
Proved Reserves of Natural Gas
Total Coal Consumption
Coal, Net Exports/Imports (-)
Total Electricity Net Generation
Total Electricity Net Consumption
Electricity, Net Exports/Imports (-)
Total Conventional Thermal Electricity Net Generation
Hydroelectricity Net Generation
Total Primary Energy Production
Total Primary Energy Consumption
Total Carbon Dioxide Emissions from the Consumption of Energy
Population