| Business / Energy Data |
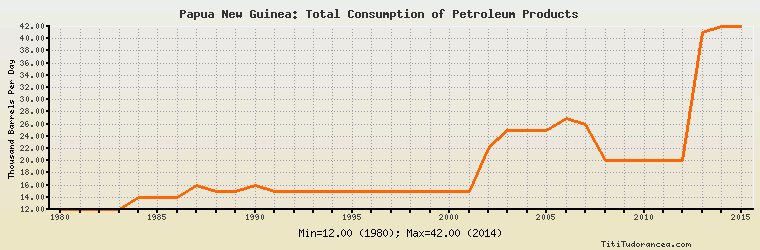
Papua New Guinea: Total Consumption of Petroleum Products
Thousand Barrels Per Day
| Year | Papua New Guinea | Change, percent | Papua New Guinea, percent of Asia & Oceania | Papua New Guinea, percent of World |
| 1980 | 12.000 | N/A | 0.112% | 0.019% |
| 1981 | 12.000 | 0.000% | 0.113% | 0.020% |
| 1982 | 12.000 | 0.000% | 0.115% | 0.020% |
| 1983 | 12.000 | 0.000% | 0.116% | 0.020% |
| 1984 | 14.000 | 16.667% | 0.130% | 0.023% |
| 1985 | 14.000 | 0.000% | 0.130% | 0.023% |
| 1986 | 14.000 | 0.000% | 0.126% | 0.023% |
| 1987 | 16.000 | 14.286% | 0.139% | 0.025% |
| 1988 | 15.000 | -6.250% | 0.121% | 0.023% |
| 1989 | 15.000 | 0.000% | 0.114% | 0.023% |
| 1990 | 16.000 | 6.667% | 0.116% | 0.024% |
| 1991 | 15.000 | -6.250% | 0.104% | 0.022% |
| 1992 | 15.000 | 0.000% | 0.099% | 0.022% |
| 1993 | 15.000 | 0.000% | 0.094% | 0.022% |
| 1994 | 15.000 | 0.000% | 0.088% | 0.022% |
| 1995 | 15.000 | 0.000% | 0.084% | 0.021% |
| 1996 | 15.000 | 0.000% | 0.080% | 0.021% |
| 1997 | 15.000 | 0.000% | 0.077% | 0.020% |
| 1998 | 15.000 | 0.000% | 0.078% | 0.020% |
| 1999 | 15.000 | 0.000% | 0.074% | 0.020% |
| 2000 | 15.000 | 0.000% | 0.072% | 0.019% |
| 2001 | 15.000 | 0.000% | 0.072% | 0.019% |
| 2002 | 22.000 | 46.667% | 0.102% | 0.028% |
| 2003 | 25.000 | 13.636% | 0.111% | 0.031% |
| 2004 | 25.000 | 0.000% | 0.105% | 0.030% |
| 2005 | 25.000 | 0.000% | 0.103% | 0.030% |
| 2006 | 27.000 | 8.000% | 0.108% | 0.032% |
| 2007 | 26.000 | -3.704% | 0.102% | 0.030% |
| 2008 | 20.000 | -23.077% | 0.079% | 0.023% |
| 2009 | 20.000 | 0.000% | 0.076% | 0.023% |
| 2010 | 20.000 | 0.000% | 0.071% | 0.022% |
| 2011 | 20.000 | 0.000% | 0.069% | 0.022% |
| 2012 | 20.000 | 0.000% | 0.067% | 0.022% |
| 2013 | 41.000 | 105.000% | 0.133% | 0.044% |
| 2014 | 42.000 | 2.439% | 0.135% | 0.045% |
| 2015 | 42.000 | 0.000% | 0.130% | 0.044% |
Historical Energy Data about Papua New Guinea
Total Oil Supply
Total Consumption of Petroleum Products
Oil and Petroleum Products, Net Exports/Imports (-)
Production of Crude Oil including Lease Condensate
Crude Oil Proved Reserves
Dry Natural Gas Production
Dry Natural Gas Consumption
Dry Natural Gas, Net Exports/Imports (-)
Proved Reserves of Natural Gas
Total Coal Consumption
Coal, Net Exports/Imports (-)
Total Electricity Net Generation
Total Electricity Net Consumption
Electricity, Net Exports/Imports (-)
Total Conventional Thermal Electricity Net Generation
Hydroelectricity Net Generation
Total Primary Energy Production
Total Primary Energy Consumption
Total Carbon Dioxide Emissions from the Consumption of Energy
Population