| Business / Energy Data |
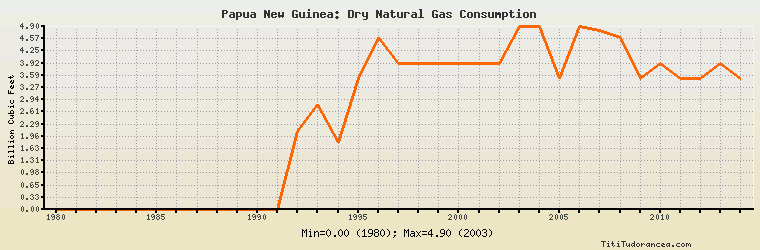
Papua New Guinea: Dry Natural Gas Consumption
Billion Cubic Feet
| Year | Papua New Guinea | Change, percent | Papua New Guinea, percent of Asia & Oceania | Papua New Guinea, percent of World |
| 1980 | 0.000 | N/A | 0.00% | 0.00% |
| 1981 | 0.000 | 0.000% | 0.00% | 0.00% |
| 1982 | 0.000 | 0.000% | 0.00% | 0.00% |
| 1983 | 0.000 | 0.000% | 0.00% | 0.00% |
| 1984 | 0.000 | 0.000% | 0.00% | 0.00% |
| 1985 | 0.000 | 0.000% | 0.00% | 0.00% |
| 1986 | 0.000 | 0.000% | 0.00% | 0.00% |
| 1987 | 0.000 | 0.000% | 0.00% | 0.00% |
| 1988 | 0.000 | 0.000% | 0.00% | 0.00% |
| 1989 | 0.000 | 0.000% | 0.00% | 0.00% |
| 1990 | 0.000 | 0.000% | 0.00% | 0.00% |
| 1991 | 0.000 | 0.000% | 0.00% | 0.00% |
| 1992 | 2.100 | 0.000% | 0.032% | 0.003% |
| 1993 | 2.800 | 33.333% | 0.040% | 0.004% |
| 1994 | 1.800 | -35.714% | 0.024% | 0.002% |
| 1995 | 3.500 | 94.444% | 0.044% | 0.004% |
| 1996 | 4.600 | 31.429% | 0.053% | 0.006% |
| 1997 | 3.900 | -15.217% | 0.043% | 0.005% |
| 1998 | 3.900 | 0.000% | 0.042% | 0.005% |
| 1999 | 3.900 | 0.000% | 0.039% | 0.005% |
| 2000 | 3.900 | 0.000% | 0.037% | 0.004% |
| 2001 | 3.900 | 0.000% | 0.036% | 0.004% |
| 2002 | 3.900 | 0.000% | 0.034% | 0.004% |
| 2003 | 4.900 | 25.641% | 0.040% | 0.005% |
| 2004 | 4.900 | 0.000% | 0.038% | 0.005% |
| 2005 | 3.500 | -28.571% | 0.025% | 0.004% |
| 2006 | 4.900 | 40.000% | 0.032% | 0.005% |
| 2007 | 4.800 | -2.041% | 0.028% | 0.005% |
| 2008 | 4.600 | -4.167% | 0.026% | 0.004% |
| 2009 | 3.500 | -23.913% | 0.019% | 0.003% |
| 2010 | 3.900 | 11.429% | 0.019% | 0.003% |
| 2011 | 3.500 | -10.256% | 0.016% | 0.003% |
| 2012 | 3.500 | 0.000% | 0.015% | 0.003% |
| 2013 | 3.900 | 11.429% | 0.016% | 0.003% |
| 2014 | 3.500 | -10.256% | 0.014% | 0.003% |
Historical Energy Data about Papua New Guinea
Total Oil Supply
Total Consumption of Petroleum Products
Oil and Petroleum Products, Net Exports/Imports (-)
Production of Crude Oil including Lease Condensate
Crude Oil Proved Reserves
Dry Natural Gas Production
Dry Natural Gas Consumption
Dry Natural Gas, Net Exports/Imports (-)
Proved Reserves of Natural Gas
Total Coal Consumption
Coal, Net Exports/Imports (-)
Total Electricity Net Generation
Total Electricity Net Consumption
Electricity, Net Exports/Imports (-)
Total Conventional Thermal Electricity Net Generation
Hydroelectricity Net Generation
Total Primary Energy Production
Total Primary Energy Consumption
Total Carbon Dioxide Emissions from the Consumption of Energy
Population