| Business / Energy Data |
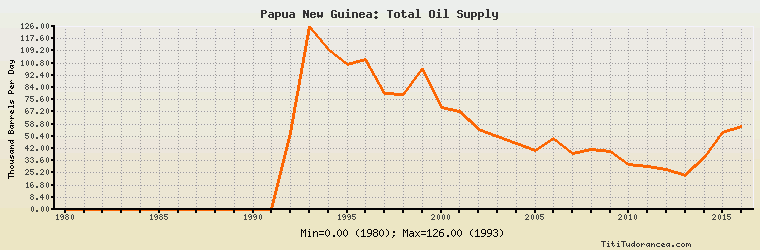
Papua New Guinea: Total Oil Supply
Thousand Barrels Per Day
| Year | Papua New Guinea | Change, percent | Papua New Guinea, percent of Asia & Oceania | Papua New Guinea, percent of World |
| 1980 | 0.000 | N/A | 0.00% | 0.00% |
| 1981 | 0.000 | 0.000% | 0.00% | 0.00% |
| 1982 | 0.000 | 0.000% | 0.00% | 0.00% |
| 1983 | 0.000 | 0.000% | 0.00% | 0.00% |
| 1984 | 0.000 | 0.000% | 0.00% | 0.00% |
| 1985 | 0.000 | 0.000% | 0.00% | 0.00% |
| 1986 | 0.000 | 0.000% | 0.00% | 0.00% |
| 1987 | 0.000 | 0.000% | 0.00% | 0.00% |
| 1988 | 0.000 | 0.000% | 0.00% | 0.00% |
| 1989 | 0.000 | 0.000% | 0.00% | 0.00% |
| 1990 | 0.000 | 0.000% | 0.00% | 0.00% |
| 1991 | 0.200 | 0.000% | 0.003% | 0.000% |
| 1992 | 53.000 | 26,400.000% | 0.766% | 0.080% |
| 1993 | 126.000 | 137.736% | 1.796% | 0.188% |
| 1994 | 110.000 | -12.698% | 1.528% | 0.160% |
| 1995 | 100.000 | -9.091% | 1.333% | 0.142% |
| 1996 | 103.000 | 3.000% | 1.331% | 0.143% |
| 1997 | 80.000 | -22.330% | 1.007% | 0.108% |
| 1998 | 79.000 | -1.250% | 0.982% | 0.104% |
| 1999 | 97.000 | 22.785% | 1.201% | 0.130% |
| 2000 | 70.085 | -27.747% | 0.842% | 0.090% |
| 2001 | 67.523 | -3.656% | 0.814% | 0.087% |
| 2002 | 55.153 | -18.320% | 0.663% | 0.072% |
| 2003 | 50.493 | -8.449% | 0.611% | 0.063% |
| 2004 | 45.601 | -9.688% | 0.544% | 0.055% |
| 2005 | 40.304 | -11.616% | 0.471% | 0.047% |
| 2006 | 48.751 | 20.958% | 0.565% | 0.057% |
| 2007 | 38.681 | -20.656% | 0.447% | 0.045% |
| 2008 | 41.462 | 7.190% | 0.470% | 0.048% |
| 2009 | 39.706 | -4.235% | 0.446% | 0.046% |
| 2010 | 30.953 | -22.045% | 0.331% | 0.035% |
| 2011 | 29.320 | -5.276% | 0.314% | 0.033% |
| 2012 | 27.489 | -6.245% | 0.290% | 0.030% |
| 2013 | 23.120 | -15.894% | 0.243% | 0.025% |
| 2014 | 35.509 | 53.586% | 0.368% | 0.038% |
| 2015 | 52.761 | 48.585% | 0.539% | 0.055% |
| 2016 | 56.825 | 7.703% | 0.598% | 0.058% |
Historical Energy Data about Papua New Guinea
Total Oil Supply
Total Consumption of Petroleum Products
Oil and Petroleum Products, Net Exports/Imports (-)
Production of Crude Oil including Lease Condensate
Crude Oil Proved Reserves
Dry Natural Gas Production
Dry Natural Gas Consumption
Dry Natural Gas, Net Exports/Imports (-)
Proved Reserves of Natural Gas
Total Coal Consumption
Coal, Net Exports/Imports (-)
Total Electricity Net Generation
Total Electricity Net Consumption
Electricity, Net Exports/Imports (-)
Total Conventional Thermal Electricity Net Generation
Hydroelectricity Net Generation
Total Primary Energy Production
Total Primary Energy Consumption
Total Carbon Dioxide Emissions from the Consumption of Energy
Population