| Business / Energy Data |
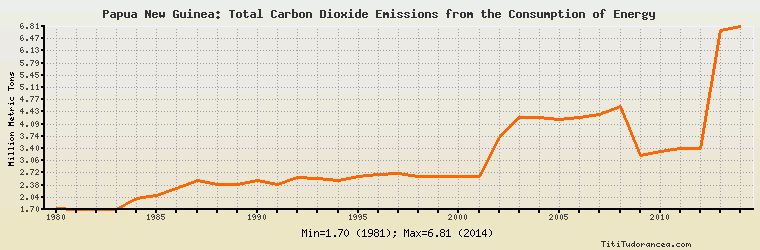
Papua New Guinea: Total Carbon Dioxide Emissions from the Consumption of Energy
Million Metric Tons
| Year | Papua New Guinea | Change, percent | Papua New Guinea, percent of Asia & Oceania | Papua New Guinea, percent of World |
| 1980 | 1.719 | N/A | 0.049% | 0.009% |
| 1981 | 1.700 | -1.105% | 0.048% | 0.009% |
| 1982 | 1.700 | 0.000% | 0.047% | 0.009% |
| 1983 | 1.700 | 0.000% | 0.046% | 0.009% |
| 1984 | 2.000 | 17.647% | 0.050% | 0.011% |
| 1985 | 2.100 | 5.000% | 0.051% | 0.011% |
| 1986 | 2.300 | 9.524% | 0.055% | 0.012% |
| 1987 | 2.500 | 8.696% | 0.057% | 0.012% |
| 1988 | 2.400 | -4.000% | 0.051% | 0.011% |
| 1989 | 2.400 | 0.000% | 0.050% | 0.011% |
| 1990 | 2.500 | 4.167% | 0.048% | 0.012% |
| 1991 | 2.400 | -4.000% | 0.046% | 0.011% |
| 1992 | 2.606 | 8.583% | 0.048% | 0.012% |
| 1993 | 2.559 | -1.804% | 0.045% | 0.012% |
| 1994 | 2.506 | -2.071% | 0.042% | 0.012% |
| 1995 | 2.612 | 4.230% | 0.041% | 0.012% |
| 1996 | 2.665 | 2.029% | 0.040% | 0.012% |
| 1997 | 2.712 | 1.764% | 0.041% | 0.012% |
| 1998 | 2.612 | -3.687% | 0.039% | 0.012% |
| 1999 | 2.612 | 0.000% | 0.038% | 0.011% |
| 2000 | 2.612 | 0.000% | 0.036% | 0.011% |
| 2001 | 2.612 | 0.000% | 0.035% | 0.011% |
| 2002 | 3.712 | 42.113% | 0.047% | 0.015% |
| 2003 | 4.265 | 14.898% | 0.049% | 0.017% |
| 2004 | 4.265 | 0.000% | 0.045% | 0.016% |
| 2005 | 4.212 | -1.243% | 0.041% | 0.015% |
| 2006 | 4.265 | 1.258% | 0.039% | 0.015% |
| 2007 | 4.365 | 2.345% | 0.038% | 0.015% |
| 2008 | 4.565 | 4.582% | 0.039% | 0.015% |
| 2009 | 3.212 | -29.639% | 0.026% | 0.011% |
| 2010 | 3.312 | 3.113% | 0.025% | 0.011% |
| 2011 | 3.412 | 3.019% | 0.024% | 0.011% |
| 2012 | 3.412 | 0.000% | 0.022% | 0.010% |
| 2013 | 6.712 | 96.717% | 0.042% | 0.020% |
| 2014 | 6.812 | 1.490% | 0.043% | 0.020% |
Historical Energy Data about Papua New Guinea
Total Oil Supply
Total Consumption of Petroleum Products
Oil and Petroleum Products, Net Exports/Imports (-)
Production of Crude Oil including Lease Condensate
Crude Oil Proved Reserves
Dry Natural Gas Production
Dry Natural Gas Consumption
Dry Natural Gas, Net Exports/Imports (-)
Proved Reserves of Natural Gas
Total Coal Consumption
Coal, Net Exports/Imports (-)
Total Electricity Net Generation
Total Electricity Net Consumption
Electricity, Net Exports/Imports (-)
Total Conventional Thermal Electricity Net Generation
Hydroelectricity Net Generation
Total Primary Energy Production
Total Primary Energy Consumption
Total Carbon Dioxide Emissions from the Consumption of Energy
Population