| Business / Energy Data |
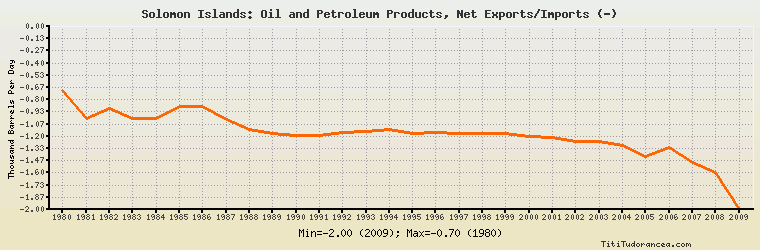
Solomon Islands: Oil and Petroleum Products, Net Exports/Imports (-)
Thousand Barrels Per Day
| Year | Solomon Islands | Change, percent | Solomon Islands, percent of Asia & Oceania | Solomon Islands, percent of World |
| 1980 | -0.700 | N/A | 0.012% | N/A |
| 1981 | -1.000 | 42.857% | 0.018% | N/A |
| 1982 | -0.900 | -10.000% | 0.016% | N/A |
| 1983 | -1.000 | 11.111% | 0.020% | N/A |
| 1984 | -1.000 | 0.000% | 0.020% | N/A |
| 1985 | -0.876 | -12.400% | 0.019% | N/A |
| 1986 | -0.877 | 0.114% | 0.018% | N/A |
| 1987 | -1.013 | 15.507% | 0.019% | N/A |
| 1988 | -1.125 | 11.056% | 0.019% | N/A |
| 1989 | -1.166 | 3.644% | 0.018% | N/A |
| 1990 | -1.186 | 1.715% | 0.017% | N/A |
| 1991 | -1.186 | 0.000% | 0.016% | N/A |
| 1992 | -1.162 | -2.024% | 0.014% | N/A |
| 1993 | -1.145 | -1.463% | 0.013% | N/A |
| 1994 | -1.125 | -1.747% | 0.011% | N/A |
| 1995 | -1.166 | 3.644% | 0.011% | N/A |
| 1996 | -1.162 | -0.343% | 0.011% | N/A |
| 1997 | -1.166 | 0.344% | 0.010% | N/A |
| 1998 | -1.166 | 0.000% | 0.010% | N/A |
| 1999 | -1.166 | 0.000% | 0.010% | N/A |
| 2000 | -1.206 | 3.431% | 0.010% | N/A |
| 2001 | -1.209 | 0.249% | 0.010% | N/A |
| 2002 | -1.253 | 3.639% | 0.009% | N/A |
| 2003 | -1.253 | 0.000% | 0.009% | N/A |
| 2004 | -1.296 | 3.432% | 0.008% | N/A |
| 2005 | -1.426 | 10.031% | 0.009% | N/A |
| 2006 | -1.323 | -7.223% | 0.008% | N/A |
| 2007 | -1.485 | 12.245% | 0.009% | N/A |
| 2008 | -1.600 | 7.744% | 0.010% | N/A |
| 2009 | -2.000 | 25.000% | 0.012% | N/A |
Historical Energy Data about Solomon Islands
Total Consumption of Petroleum Products
Oil and Petroleum Products, Net Exports/Imports (-)
Dry Natural Gas, Net Exports/Imports (-)
Coal, Net Exports/Imports (-)
Total Electricity Net Generation
Total Electricity Net Consumption
Electricity, Net Exports/Imports (-)
Total Conventional Thermal Electricity Net Generation
Total Primary Energy Consumption
Total Carbon Dioxide Emissions from the Consumption of Energy
Population