| Business / Demographics |
U.S. Pacific Islands: Population
Millions
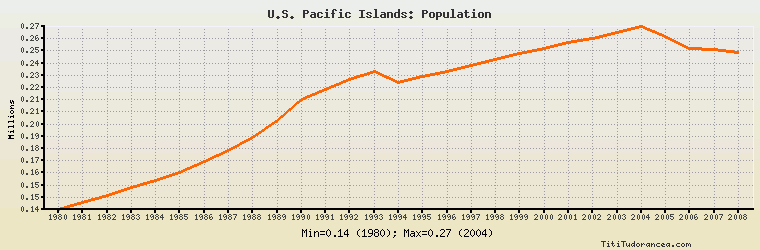
| Year | U.S. Pacific Islands | Change, percent | U.S. Pacific Islands, percent of Asia & Oceania | U.S. Pacific Islands, percent of World |
| 1980 | 0.138 | N/A | 0.006% | 0.003% |
| 1981 | 0.143 | 3.623% | 0.006% | 0.003% |
| 1982 | 0.148 | 3.497% | 0.006% | 0.003% |
| 1983 | 0.153 | 3.378% | 0.006% | 0.003% |
| 1984 | 0.158 | 3.268% | 0.006% | 0.003% |
| 1985 | 0.164 | 3.797% | 0.006% | 0.003% |
| 1986 | 0.171 | 4.268% | 0.006% | 0.003% |
| 1987 | 0.179 | 4.678% | 0.006% | 0.004% |
| 1988 | 0.188 | 5.028% | 0.007% | 0.004% |
| 1989 | 0.200 | 6.383% | 0.007% | 0.004% |
| 1990 | 0.214 | 7.000% | 0.007% | 0.004% |
| 1991 | 0.221 | 3.271% | 0.007% | 0.004% |
| 1992 | 0.228 | 3.167% | 0.007% | 0.004% |
| 1993 | 0.234 | 2.632% | 0.008% | 0.004% |
| 1994 | 0.226 | -3.419% | 0.007% | 0.004% |
| 1995 | 0.230 | 1.770% | 0.007% | 0.004% |
| 1996 | 0.234 | 1.739% | 0.007% | 0.004% |
| 1997 | 0.238 | 1.709% | 0.007% | 0.004% |
| 1998 | 0.242 | 1.681% | 0.007% | 0.004% |
| 1999 | 0.246 | 1.653% | 0.007% | 0.004% |
| 2000 | 0.250 | 1.626% | 0.007% | 0.004% |
| 2001 | 0.254 | 1.600% | 0.007% | 0.004% |
| 2002 | 0.257 | 1.181% | 0.007% | 0.004% |
| 2003 | 0.261 | 1.556% | 0.007% | 0.004% |
| 2004 | 0.265 | 1.533% | 0.007% | 0.004% |
| 2005 | 0.258 | -2.642% | 0.007% | 0.004% |
| 2006 | 0.250 | -3.101% | 0.007% | 0.004% |
| 2007 | 0.249 | -0.400% | 0.007% | 0.004% |
| 2008 | 0.247 | -0.803% | 0.007% | 0.004% |
| 2009 | N/A | N/A | N/A | N/A |
| 2010 | N/A | N/A | N/A | N/A |
Historical Energy Data about U.S. Pacific Islands
Total Consumption of Petroleum Products
Oil and Petroleum Products, Net Exports/Imports (-)
Dry Natural Gas, Net Exports/Imports (-)
Coal, Net Exports/Imports (-)
Total Electricity Net Generation
Total Electricity Net Consumption
Electricity, Net Exports/Imports (-)
Total Conventional Thermal Electricity Net Generation
Hydroelectricity Net Generation
Total Primary Energy Consumption
Total Carbon Dioxide Emissions from the Consumption of Energy
Population