| Business / Energy Data |
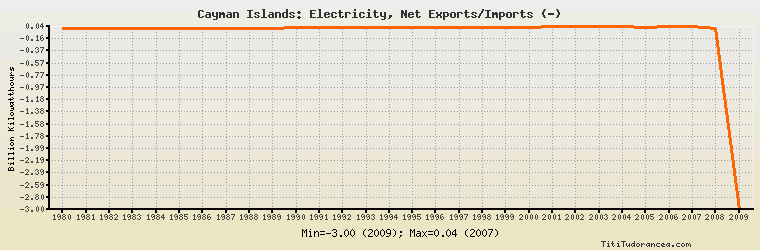
Cayman Islands: Electricity, Net Exports/Imports (-)
Billion Kilowatthours
| Year | Cayman Islands | Change, percent | Cayman Islands, percent of Central & South America | Cayman Islands, percent of World |
| 1980 | 0.004 | N/A | 4.000% | N/A |
| 1981 | 0.005 | 25.000% | 3.546% | N/A |
| 1982 | 0.005 | 0.000% | -3.968% | N/A |
| 1983 | 0.006 | 20.000% | 2.632% | N/A |
| 1984 | 0.007 | 16.667% | 7.368% | N/A |
| 1985 | 0.008 | 14.286% | 0.299% | N/A |
| 1986 | 0.009 | 12.500% | 7.087% | N/A |
| 1987 | 0.011 | 22.222% | 2.301% | N/A |
| 1988 | 0.012 | 9.091% | 7.742% | N/A |
| 1989 | 0.013 | 8.333% | -0.916% | N/A |
| 1990 | 0.015 | 15.385% | 10.870% | N/A |
| 1991 | 0.015 | 0.000% | 7.692% | N/A |
| 1992 | 0.015 | 0.000% | 300.000% | N/A |
| 1993 | 0.017 | 13.333% | - | N/A |
| 1994 | 0.019 | 11.765% | - | N/A |
| 1995 | 0.020 | 5.263% | 51.282% | N/A |
| 1996 | 0.020 | 0.000% | -0.745% | N/A |
| 1997 | 0.020 | 0.000% | 16.529% | N/A |
| 1998 | 0.020 | 0.000% | -12.346% | N/A |
| 1999 | 0.022 | 10.000% | 78.571% | N/A |
| 2000 | 0.028 | 27.273% | 2.162% | N/A |
| 2001 | 0.030 | 7.143% | -2.882% | N/A |
| 2002 | 0.031 | 3.333% | 79.487% | N/A |
| 2003 | 0.032 | 3.226% | 4.893% | N/A |
| 2004 | 0.034 | 6.250% | -8.000% | N/A |
| 2005 | 0.028 | -17.647% | -1.824% | N/A |
| 2006 | 0.034 | 21.429% | -2.484% | N/A |
| 2007 | 0.038 | 11.765% | -1.586% | N/A |
| 2008 | 0.000 | -100.000% | 0.00% | N/A |
| 2009 | -3.000 | 0.000% | 79.787% | N/A |
Historical Energy Data about Cayman Islands
Total Consumption of Petroleum Products
Oil and Petroleum Products, Net Exports/Imports (-)
Dry Natural Gas, Net Exports/Imports (-)
Coal, Net Exports/Imports (-)
Total Electricity Net Generation
Total Electricity Net Consumption
Electricity, Net Exports/Imports (-)
Total Conventional Thermal Electricity Net Generation
Total Primary Energy Consumption
Total Carbon Dioxide Emissions from the Consumption of Energy
Population