| Business / Energy Data |
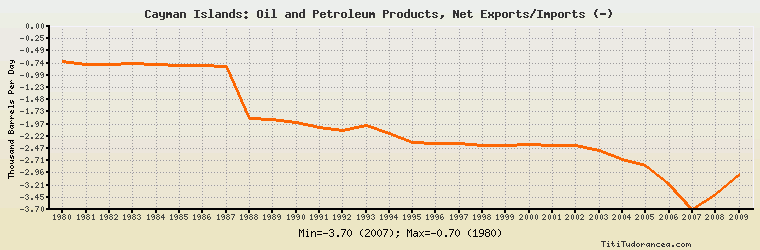
Cayman Islands: Oil and Petroleum Products, Net Exports/Imports (-)
Thousand Barrels Per Day
| Year | Cayman Islands | Change, percent | Cayman Islands, percent of Central & South America | Cayman Islands, percent of World |
| 1980 | -0.700 | N/A | -0.127% | N/A |
| 1981 | -0.760 | 8.571% | -0.252% | N/A |
| 1982 | -0.760 | 0.000% | -0.288% | N/A |
| 1983 | -0.740 | -2.632% | -0.168% | N/A |
| 1984 | -0.760 | 2.703% | -0.122% | N/A |
| 1985 | -0.787 | 3.553% | -0.114% | N/A |
| 1986 | -0.788 | 0.127% | -0.115% | N/A |
| 1987 | -0.813 | 3.173% | -0.160% | N/A |
| 1988 | -1.862 | 129.028% | -0.264% | N/A |
| 1989 | -1.887 | 1.343% | -0.255% | N/A |
| 1990 | -1.936 | 2.597% | -0.208% | N/A |
| 1991 | -2.052 | 5.992% | -0.184% | N/A |
| 1992 | -2.098 | 2.242% | -0.191% | N/A |
| 1993 | -1.997 | -4.814% | -0.164% | N/A |
| 1994 | -2.173 | 8.813% | -0.155% | N/A |
| 1995 | -2.355 | 8.376% | -0.143% | N/A |
| 1996 | -2.365 | 0.425% | -0.128% | N/A |
| 1997 | -2.371 | 0.254% | -0.112% | N/A |
| 1998 | -2.414 | 1.814% | -0.118% | N/A |
| 1999 | -2.414 | 0.000% | -0.134% | N/A |
| 2000 | -2.387 | -1.118% | -0.118% | N/A |
| 2001 | -2.414 | 1.131% | -0.128% | N/A |
| 2002 | -2.414 | 0.000% | -0.142% | N/A |
| 2003 | -2.501 | 3.604% | -0.167% | N/A |
| 2004 | -2.698 | 7.877% | -0.170% | N/A |
| 2005 | -2.818 | 4.448% | -0.173% | N/A |
| 2006 | -3.192 | 13.272% | -0.215% | N/A |
| 2007 | -3.700 | 15.915% | -0.275% | N/A |
| 2008 | -3.400 | -8.108% | -0.204% | N/A |
| 2009 | -3.000 | -11.765% | -0.195% | N/A |
Historical Energy Data about Cayman Islands
Total Consumption of Petroleum Products
Oil and Petroleum Products, Net Exports/Imports (-)
Dry Natural Gas, Net Exports/Imports (-)
Coal, Net Exports/Imports (-)
Total Electricity Net Generation
Total Electricity Net Consumption
Electricity, Net Exports/Imports (-)
Total Conventional Thermal Electricity Net Generation
Total Primary Energy Consumption
Total Carbon Dioxide Emissions from the Consumption of Energy
Population